


ADA Technical Analysis: Bullish Reversal Launch At $0.45 Struggles
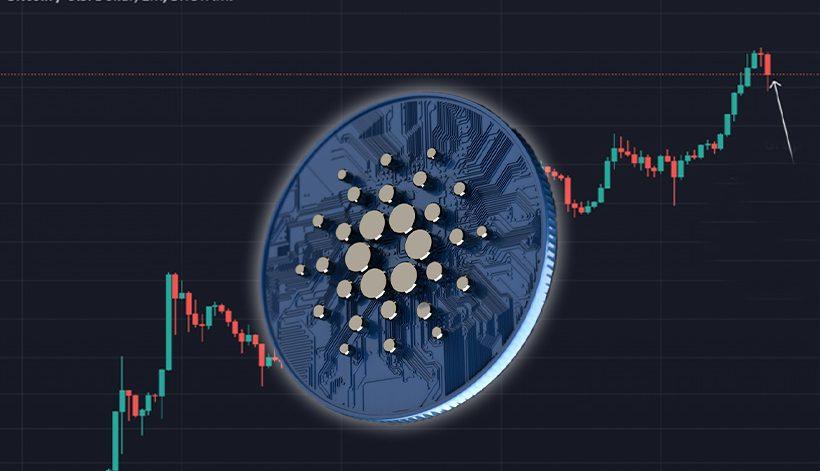


Table of contents
Key technical points:
Past Performance of ADA
ADA prices failed to surpass the $0.65 resistance resulting in a double top pattern breakout that resulted in a 30% price drop. The reversal comes with the rejection at the 50-day EMA (red), kickstarting the price fall to the $0.45 mark. Buyers attempt to overtake the trend control at $0.45 despite the psychological barrier fallout at $0.50.

Source- Tradingview
ADA Technical Analysis
The formation of the bullish engulfing candle at the high demand zone of $0.45, increases the reversal possibility. However, the traders should wait for closing above the psychological mark of $0.50 for better confirmation. Concerning a triple retest to the $0.45 horizontal support level, the daily-RSI slope showed a higher low formation indicating growth in underlying bullishness. This positive divergence from the indicator bolsters the reversal theory.
However, the MACD indicator offers a bearish crossover among the fast and slow lines, suggesting a continuation of the prevailing trendline. However, a significant spread among these slopes is needed for better confirmation. The 20-50-and-100-day has provided dynamic resistance to the ADA price since the current down initiated in November. Thus, the indicator shows rising bullish momentum as the coin price retest the $0.45 support. However, the opposing RSI and MACD signal suggests traders to wait for a price action confirmation. In short, the ADA technical analysis predicts a reversal possibility from the $0.45 support.
Upcoming Trend
Suppose the buying pressure helps the engulfing candle close above $0.50; ADA buyers can expect the reversal rally to reach the $0.65 mark.
Resistance Levels: $0.50 and $0.65
Support Levels: $0.45 and $0.40