


ADA Technical Analysis: Cardano Set to be Bullish for the Next 24 hours


Key Technical Points:
Past Performance of ADA
ADA technical analysis shows that the coin has had a bullish run in the past and is currently testing the key resistance at $0.52. The technicals are overall bullish for ADA. The closest support is found at $0.30. ADA is expected to find support at $0.33 and continue its upward trend. There is a possibility of a short-term price correction, but the overall trend is still bullish. Investors can expect ADA to continue its upward trend in the long term.
ADA has had a strong uptrend in the past and is currently testing a key resistance level at $0.52. The technical indicators are mostly bullish, suggesting that ADA will likely continue its upward trend sooner. However, there is a possibility of a short-term price correction, so investors should be cautious. The long-term trend is still positive, and ADA is expected to continue increasing over time.

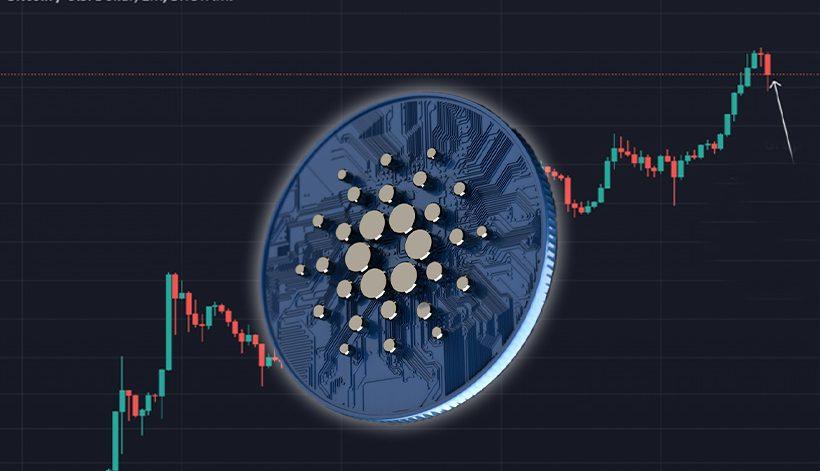
Source- Tradingview
ADA Technical Analysis
The formation of the bullish engulfing candle on the ADA/USD 4-hour chart above indicates that buyers are in control of the market. The MACD indicator is bullish, but the RSI indicator is currently overbought. Prediction Looking at the daily chart, we can see that ADA has formed a descending triangle pattern which is a bearish reversal pattern. This suggests that ADA may soon decline towards the support levels at $0.40 and $0.36. However, if the bulls can push the price above the resistance level at $0.52, then ADA may start to climb towards the $0.55 resistance level.
Upcoming Trend
Suppose the buying pressure continues and ADA breaks above the $0.52 resistance level. In that case, the next levels to watch for would be $0.55 and $0.57.