


ADA Technical Analysis: Rounding Bottom Plans To Cross $1


Key technical points:
Past Performance of ADA
The ADA coin price shows a reversal from the descending support trendline resulting in the price jump of more than 20% last fortnight. The price action shows a stronger underlying bullishness evident by the rounding bottom and the 50-day EMA breakout. However, the price action shows higher price rejection near the psychological mark of $1.

Source-Tradingview
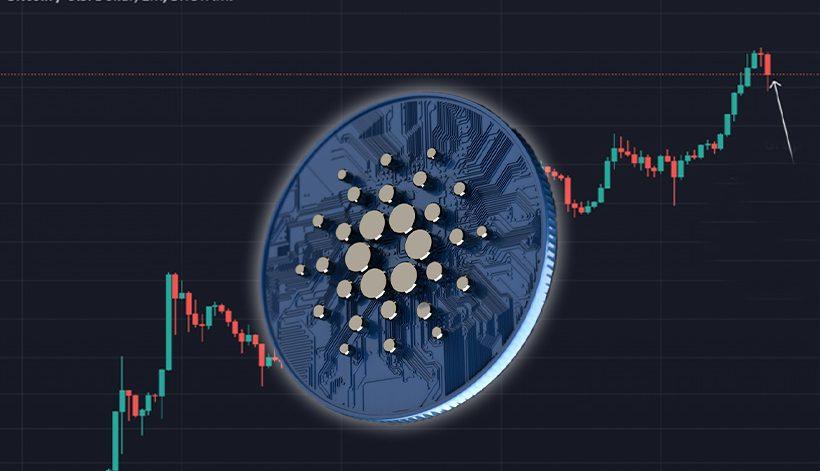
ADA Technical Analysis
ADA coin price action shows a retracement from the $1 mark that comes as the retest of the rounding bottom breakout. Hence, the psychological barrier breakout will represent an excellent buying opportunity.
The crucial EMAs (50, 100, and 200) showcase a bearish alignment despite bulls transcending the 50-day EMA and preparing to head higher after retest. Hence, a retracement to the 50-day EMA is an excellent buying opportunity. Furthermore, the breakout rally teases a jump to the 200-day EMA, accounting for a 35% jump.
RSI Indicator: The RSI slope crosses into the nearly overbought zone, with the 14-day SMA mimicking the bullish behavior. Hence, the indicator projects solid buying pressure and teases a rally to $1.125 at minimum.
MACD Indicator: The MACD and signal lines showcase a phenomenal rise with an increasing bullish spread. Moreover, the bullish histograms continue to grow in intensity, projecting a boom in buying pressure.
In a nutshell, the ADA technical analysis project a boom in buying pressure that may shortly overpass the $1 mark and approach the 200-day EMA.
Upcoming Trend
ADA coin price shows a growing underlying bullishness with the rounding bottom and the 50-day EMA breakout. However, the price must sustain above the 50-day EMA for the uptrend to grow.
Conversely, a price succumbing under the 50-day EMA will nullify the bullish ideology and result in a price fall to the $0.85 mark.
Support Levels: $0.90 and $0.85
Resistance Levels: $1.15 and $1.30