


ADA Technical Analysis: Will Sellers Enforce the $1 Retest?


Key technical points:
Past Performance of ADA
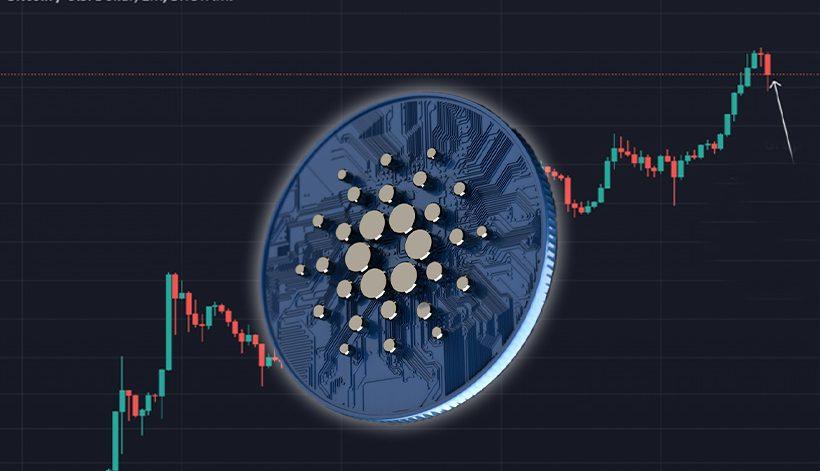
ADA coin price action shows a rounding bottom reversal from the $0.78 support level and approaches the $1.20 mark. The recovery rally breaks above the resistance confluence of the long coming resistance trendline and the rounding bottom neckline at $1. The rally accounts for almost a 50% jump but struggles to break above the $1.20 mark.

Source-Tradingview
ADA Technical Analysis
ADA coin price shows a bearish candle resulting shortly in a 4% decline on March 31st, after a period of Dohi formations. However, the recent fallout candle projects lower price rejection with a long tail formation.
The crucial daily EMAs (50, 100, and 200-days) maintain a bearish alignment with the 100-day EMA providing support. Moreover, the reversing trend of the 50-day EMA might shortly give a bullish crossover with the 100-day EMA.
Stochastic RSI Indicator: The Stochastic RSI shows the K and D lines giving a bearish crossover in the overbought territory. Hence, the indicator projects the possibility of a reversal below the 100-day EMA.
MACD Indicator: The MACD and signal lines get closer as the bullish spread diminishes and increases the chances of a bearish crossover. Moreover, the falling trend of the bullish histograms showcases a rise in underlying bearishness.
In a nutshell, the ADA technical analysis highlights the possibility of the 100-day EMA breakout.
Upcoming Trend
The ADA coin price shows lower price rejection with a long-tail formation in the daily candle. Hence, a reversal will likely jump to the $1.35 mark with the $1.20 breakout.
However, a more likely possibility is the 100-day fallout resulting in a free fall to the $1 mark.
Support Levels: $1.00 and $0.90
Resistance Levels: $1.20 and $1.35