


AVAX Technical Analysis: Is This High Volume Reversal Safe To Buy?


Table of contents
The bullish reversal in the AVAX prices with lower price rejection near $17.50 reaches the $20 mark. Furthermore, the increase in trading volume to support the bullish candle, increasing the uptrend continuation possibility. But will the bullish reversal break the resistance trendline, or is it just another low or high formation?
Key Points:
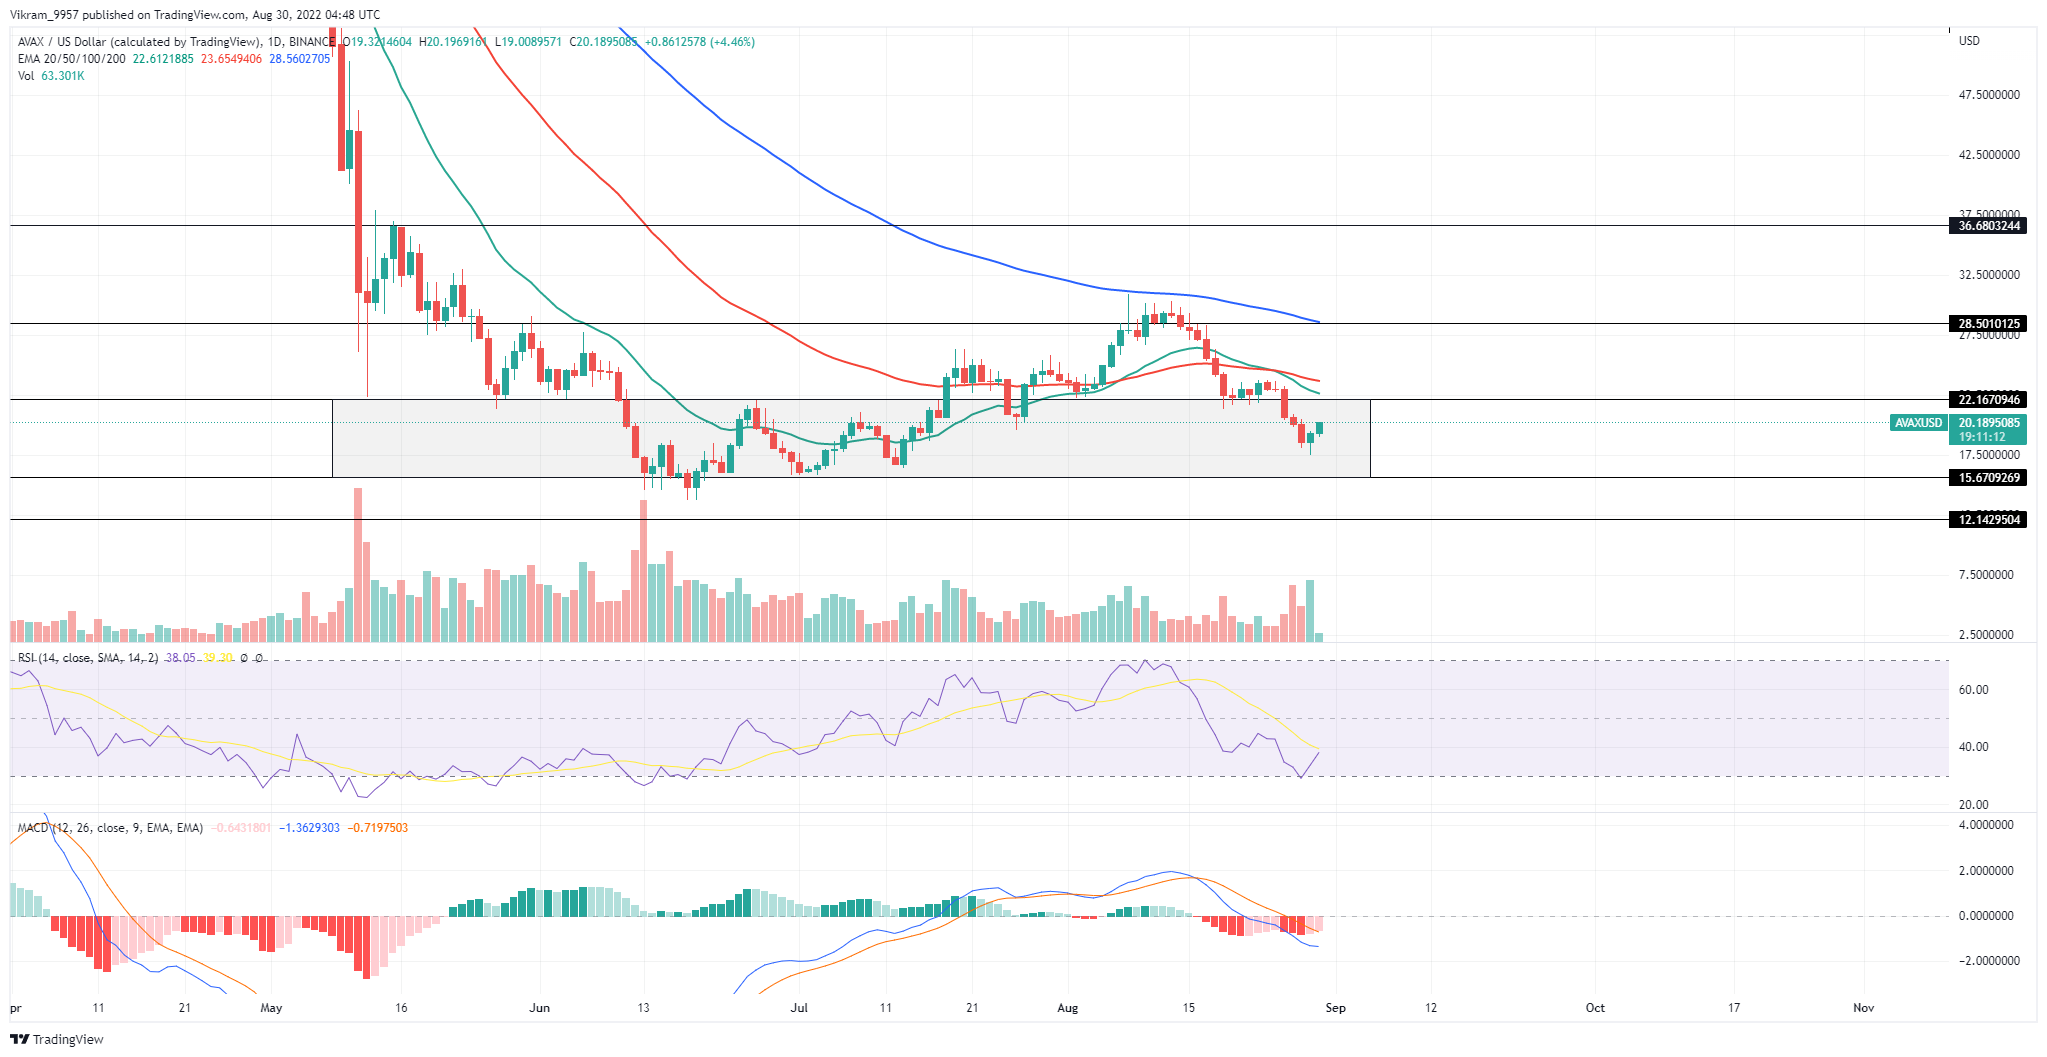
Source - Tradingview
AVAX Technical Analysis
The AVAX prices fell drastically after reaching $30 due to the increased supply at the 100-day SMA. The falling prices led to a resistance trendline, which keeps the bullish growth in check.
The recent increase in buying pressure near $17.50 led to a lower price rejection candle followed by a bullish reversal. Furthermore, the rise in trading volume supports the bullish reversal increasing the trendline breakout possibility.
If the buying pressure increases, the AVAX market value may soon reach $22 after the trendline breaks. Furthermore, a prolonged uptrend might retest the overhead resistance of $30. Hence, despite being 85% lower than its all-time high, the Avalanche token maintains a buy signal. Conversely, reversing the resistance trendline will retest the $15.67 support level.
Technical Indicators
The RSI slope displays an overall downtrend, but the recent reversal from the oversold boundary challenges the 14-day SMA. Hence, the indicator shows an increase in underlying bullishness supporting the rising AVAX prices.
The MACD indicator displays a declining trend in the fast and slow lines, but the losing bearish gap increases the possibility of a bullish crossover. Hence, the technical indicators support the possibility of a trendline breakout if the buying pressure continues to grow.
Resistance Levels: $22 and $30
Support Levels: $17.5 and $15