


AVAX Technical Analysis: Reversal Opportunity At The Last Stand Of $30


Key technical points:
Past Performance of AVAX
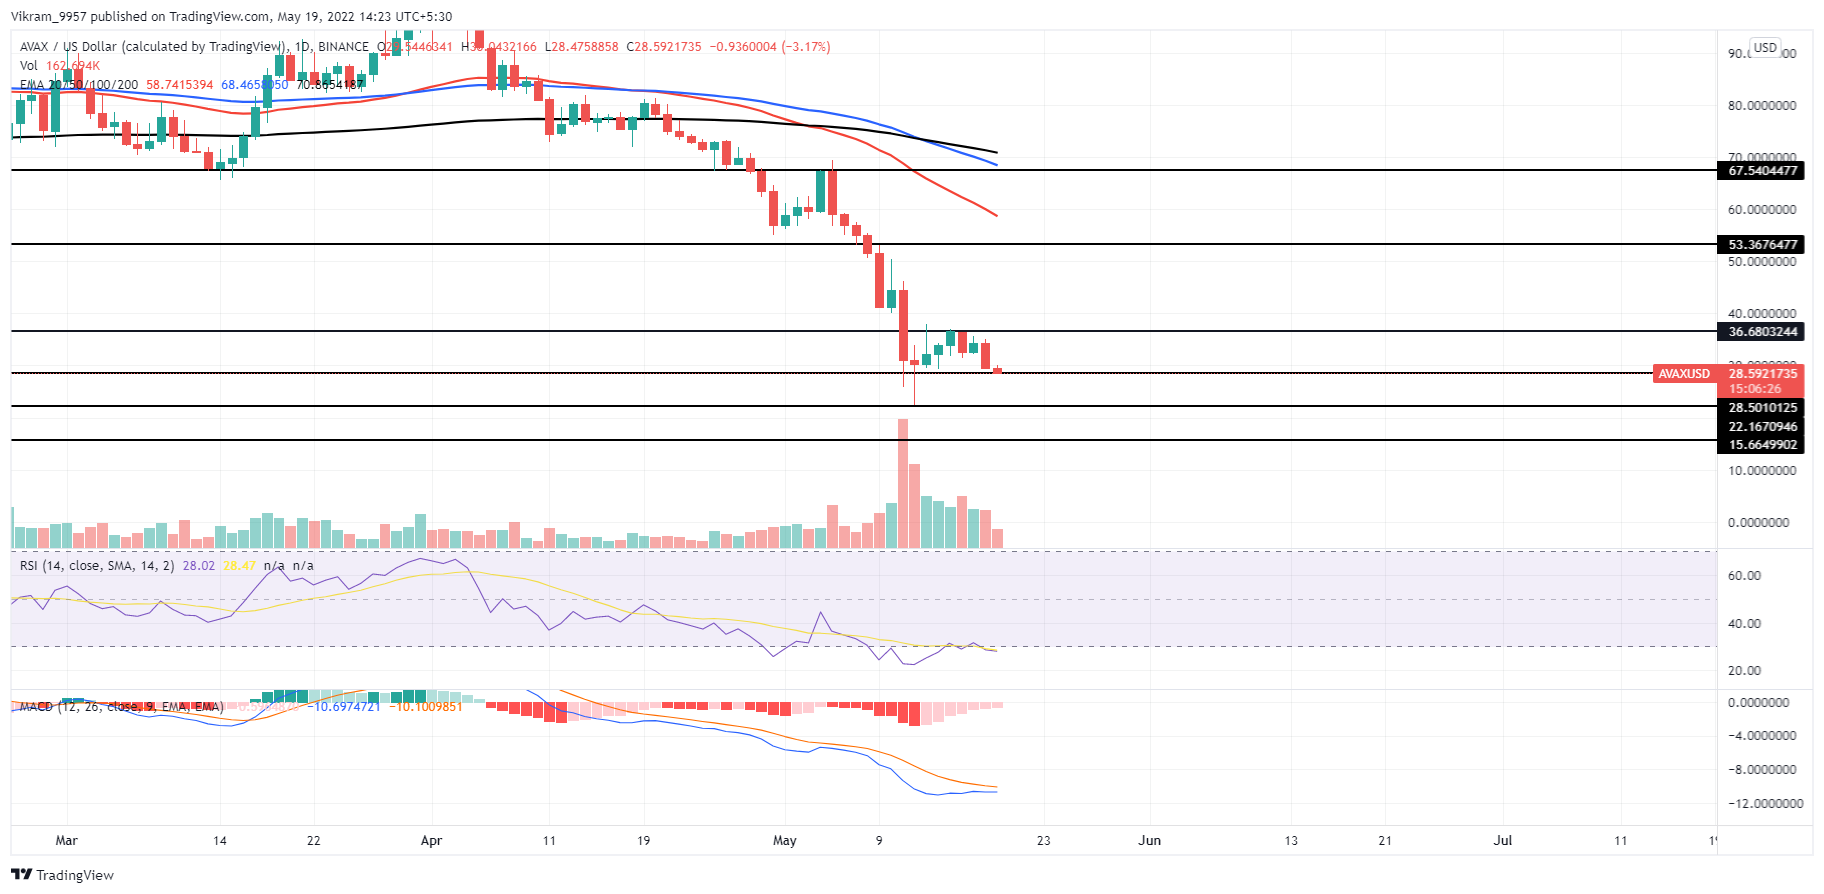
AVAX prices mimic the overall price action observed in the crypto market as the selling pressure grows drastically. The downfall depreciates the native token value by 70% in the last six weeks resulting in the $50 breakout. Moreover, the bullish failure to surpass the $37 mark results in a fall to $28 and prepares to break the low of $30.
Source-Tradingview
AVAX Technical Analysis
AVAX price represents a falling trend in the trading volume as the bearish retracement shits the support level. This increases the chances of a double bottom formation and provides a bullish reversal opportunity.
The crucial daily EMAs – 50, 100, and 200-days maintain a falling trend and achieve bearish alignment with the recent bearish crossover of 100 and 200 EMA.
Coming to the momentum indicators, the RSI values continue to decline and take a dip into the oversold area, before retesting the 14-day SMA which serves as a dynamic resistance. Moreover, the RSI slope projects a bullish divergence in the last two dips increasing the chances of a trend reversal.
The increasing bullish influence on the MACD and the signal lines is evident in the decreasing bearish spread. Therefore, traders can shortly expect a bullish crossover hinting at a trend reversal.
In short, the AVAX technical analysis projects a high possibility of a trend reversal.
Upcoming Trend
Currently, the AVAX prices stand at the crucial support level close to $30 as the sellers overtake the trend control. However, the RSI divergence at the support level increases the possibility of a double bottom pattern. Nonetheless, the traders must wait till the prices break above the $36 to avoid a bull trap.
Support Levels: $22 and $15
Resistance Levels: $36 and $53

