


AXS Technical Analysis: $11 Is A Reality


Table of contents

It's scary to say but in fact, the strong level is much lower - in the range of $3-$4. That's where we see buyers' support for the price. It was after the accumulation of positions in the range of $3-$4 that the AXS price shot more than 5000%. If the Bitcoin price does not stay in the range of $20,000 and continues to fall in the range of $10,000-$12,000 - the scenario of the AXS price fall to the $3-$4 range will be the main one.
AXS Technical Analysis On The Daily Timeframe

Analyzing the movement of the AXS price on the daily timeframe, you can see the beginning of the set of positions by buyers. In the period from 11 to 19 May, AXS trading volumes were abnormally high. At this time, buyers were trying to organize a rebound. However, given the great efforts, the result was not very successful. Confirmation of a large number of sellers in the AXS market is the daily candle from 31 May.
On this day, buyers tried to break the upper limit of consolidation of $24. Buyers were able to break the mark, but then there was an unpleasant surprise for them. Sellers with limit orders were able to stop the aggression of buyers and completely take away the initiative in the market. Conclusion from this trading situation - buyers are beginning to gain ground for growth, but are not ready to change the trend now. On 13 June, sellers unsuccessfully closed the daily candle. Looking at the trading volumes, sellers do not have enough strength to continue the fall. So we expect in the coming days the AXS price rebound to $18 and test of $11. The chance that the fall will end at $11 is quite high.
The AXSBTC Price Kept The Range 0.00057
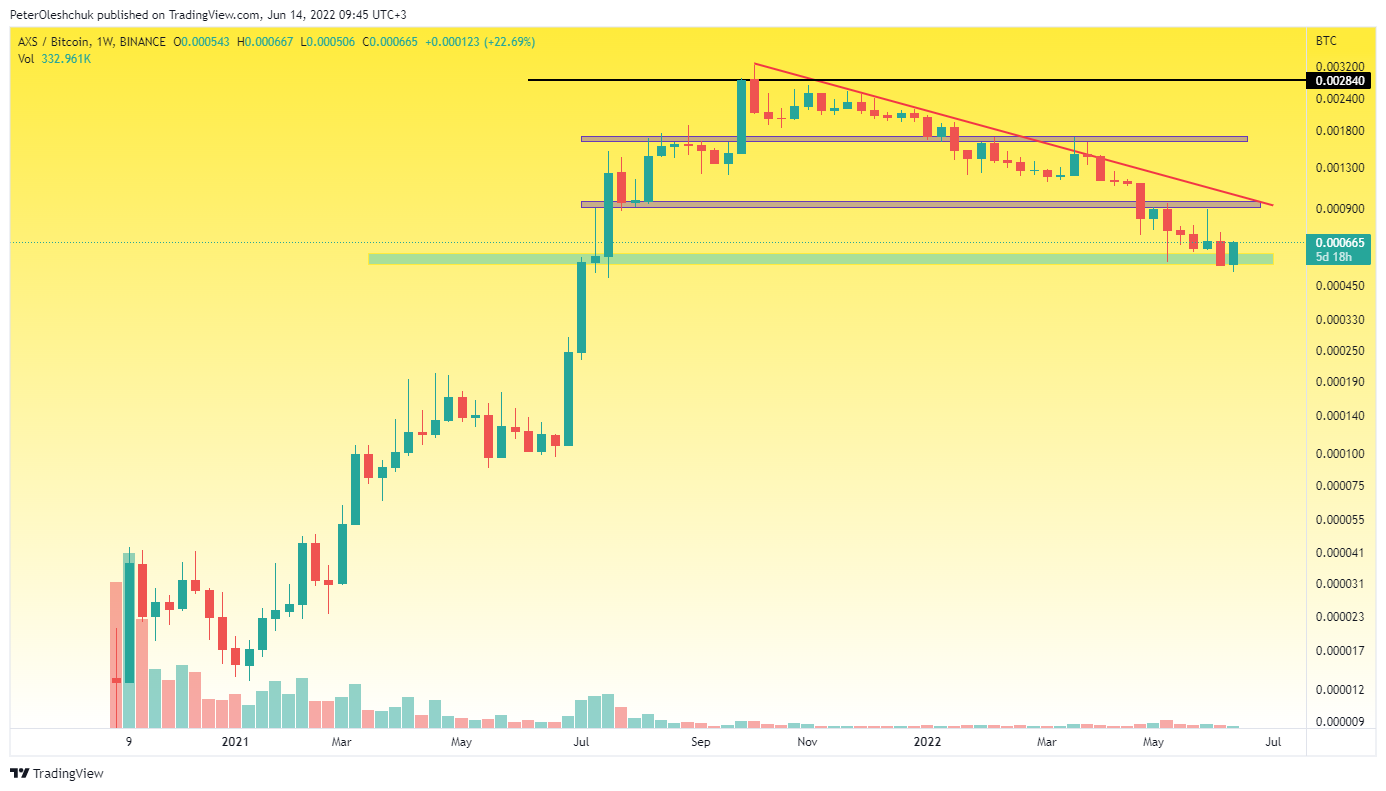
The weekly AXS chart shows us the reluctance of buyers to give out their control of the range of 0.00057. In fact, the war for this range has been going on since 9 May. The AXSBTC price has been in place for more than a month. Due to the Bitcoin weakness, AXS sinks. Though investors have stopped panic selling AXS and this is a good signal for a reversal. While the mark of 0.00057 is in the hands of buyers, the chance of starting growth with the first target of 0.001 is the highest. This mark shows the global trend line of sellers. If buyers can break and fix above this trend line, then we can predict continued growth to 0.0017.