Balancer and Fantom Technical Analysis- What to Expect?
Table of contents
Balancer (BAL) Technical Analysis
In today's Balancer technical analysis, we check what traders should expect in the coming days.
The price action of most DeFi tokens remains choppy, and BAL's is no exception.
The balancer is a swapping protocol where users can create their pools with up to eight tokens. Its native token is BAL.
Past Performance
On Apr 8, BAL prices opened at $50, closing at $53.
The BAL price is down five percent in the last trading week and is presently held within a $3 range with caps at $51 and $54 on the previous trading day.
As of writing on Apr 9, BAL trading volumes are also down 49 percent to $51 million.
Days-Ahead and What to Expect
The BAL price is trading at $53 and is under pressure. However, BAL/USD is trading within a tight range.
BAL has broken below the middle BB. Accompanying breakout is with relatively high trading volume, building a case for sellers.
Bollinger Bands (BB) are narrowing, suggesting low volatility. It reflects the indecision of the last few days.
Trading volumes are comparatively low, pales to those of mid-March. This points to cautious market participants.
BAL/USDT Technical Analysis
The BAL/USD price broke below the middle BB and is technically bearish.
As we advance, traders should watch the reaction at the primary support trend line.
Deeper losses may force BAL towards $44—the first bear target. After that, if prices don't stabilize, BAL prices may fall to $30—the 61.8 percent Fibonacci retracement of the Q1 2021 trade range.
Gains above $59 invalidates this outlook.
Fantom (FTM) Technical Analysis
The crypto tide lifted among many tokens, Fantom—a DAG-based smart contracting platform that's infinitely scalable. FTM is its main currency.
Past Performance
FTM prices remain in a consolidation.
On Apr 8, FTM opened at $0.41.
A day later, FTM prices are within Apr 8 trade range, held within a tight $0.03 range with caps at $0.45 and lows of $0.42 on the lower end.
Average trading volumes have also contracted to $107 million, falling 31 percent.
Days-Ahead and What to Expect
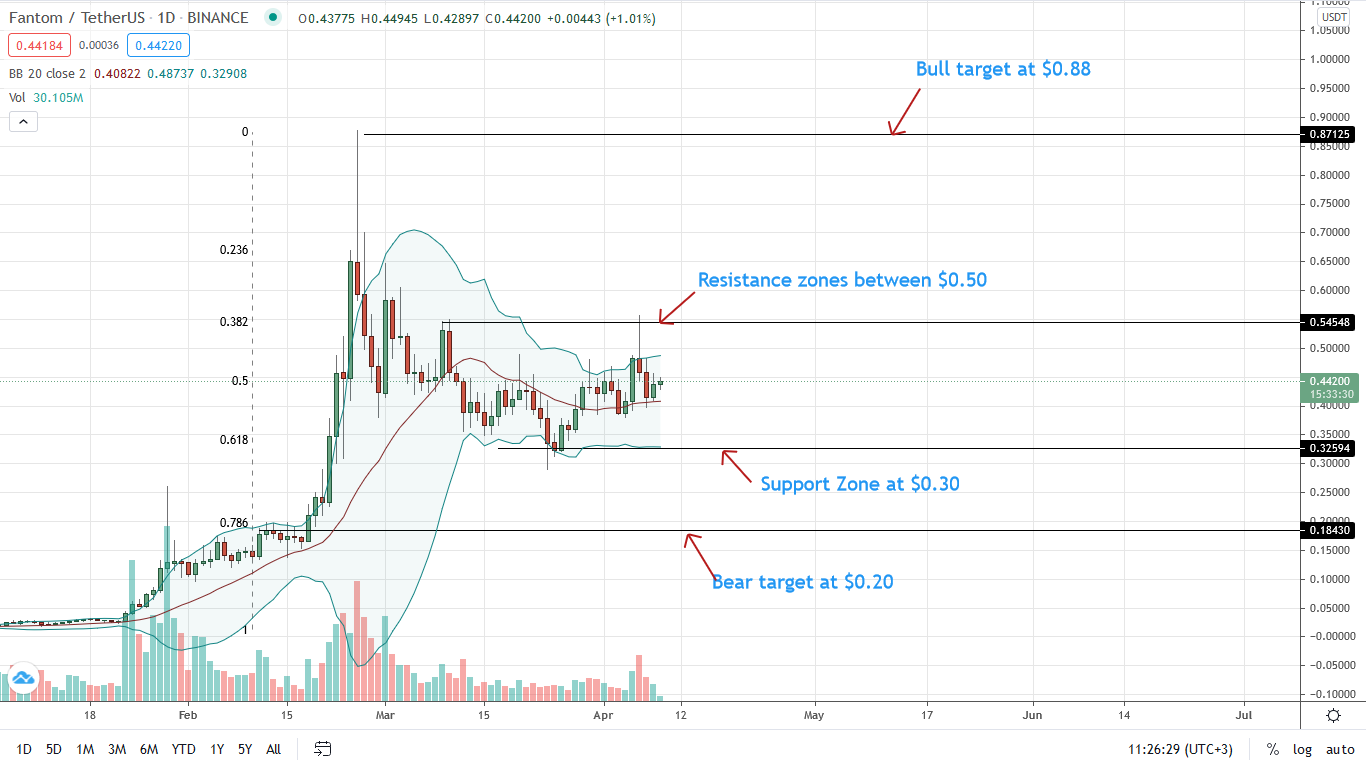
Presently, the FTM price is trading at $0.44, stable against the greenback in the last week of trading.
FTM/USDT prices remain in range mode. At the same time, BB is narrow, pointing to low volatility.
Still, FTM prices are in a broader bull flag, a net positive for optimistic bulls.
FTM/USDT Technical Analysis
Oscillating inside a bull flag, the FTM/USD price is capped within a broader $0.20 zone at $0.50 and $0.30, respectively.
These levels mark the 38.2 and 61.8 percent Fibonacci retracement levels of the Q1 2021 trade range.
Risk-averse traders can wait for a clear breakout in either direction. Gains above $0.50 could see FTM/USD prices soar to $0.88 in a retest of Feb 2021 highs.
On the lower side, Fantom technical analysis shows that steep losses may trigger a sell-off towards $0.20—the 78.6 percent Fibonacci retracement level of the same range.
Thus, Balancer and Fantom Technical Analysis show that the FTM/USD prices are capped inside a $0.20 zone and BAL prices are under pressure with resistance at $59.


