


BNB Technical Analysis: Wedge Breakout Preps Bull Run To $300


Table of contents
Key technical points:
Past Performance of BNB
The bullish recovery to regain the $200 mark propels the prices higher to the resistance trendline of the falling wedge pattern. Failing in the first attempt to surpass the resistance trendline, the price action shows a rounding bottom reversal. Additionally, the market price jumps 5.57% on the 4th of July to exceed the overhead resistance trendline.
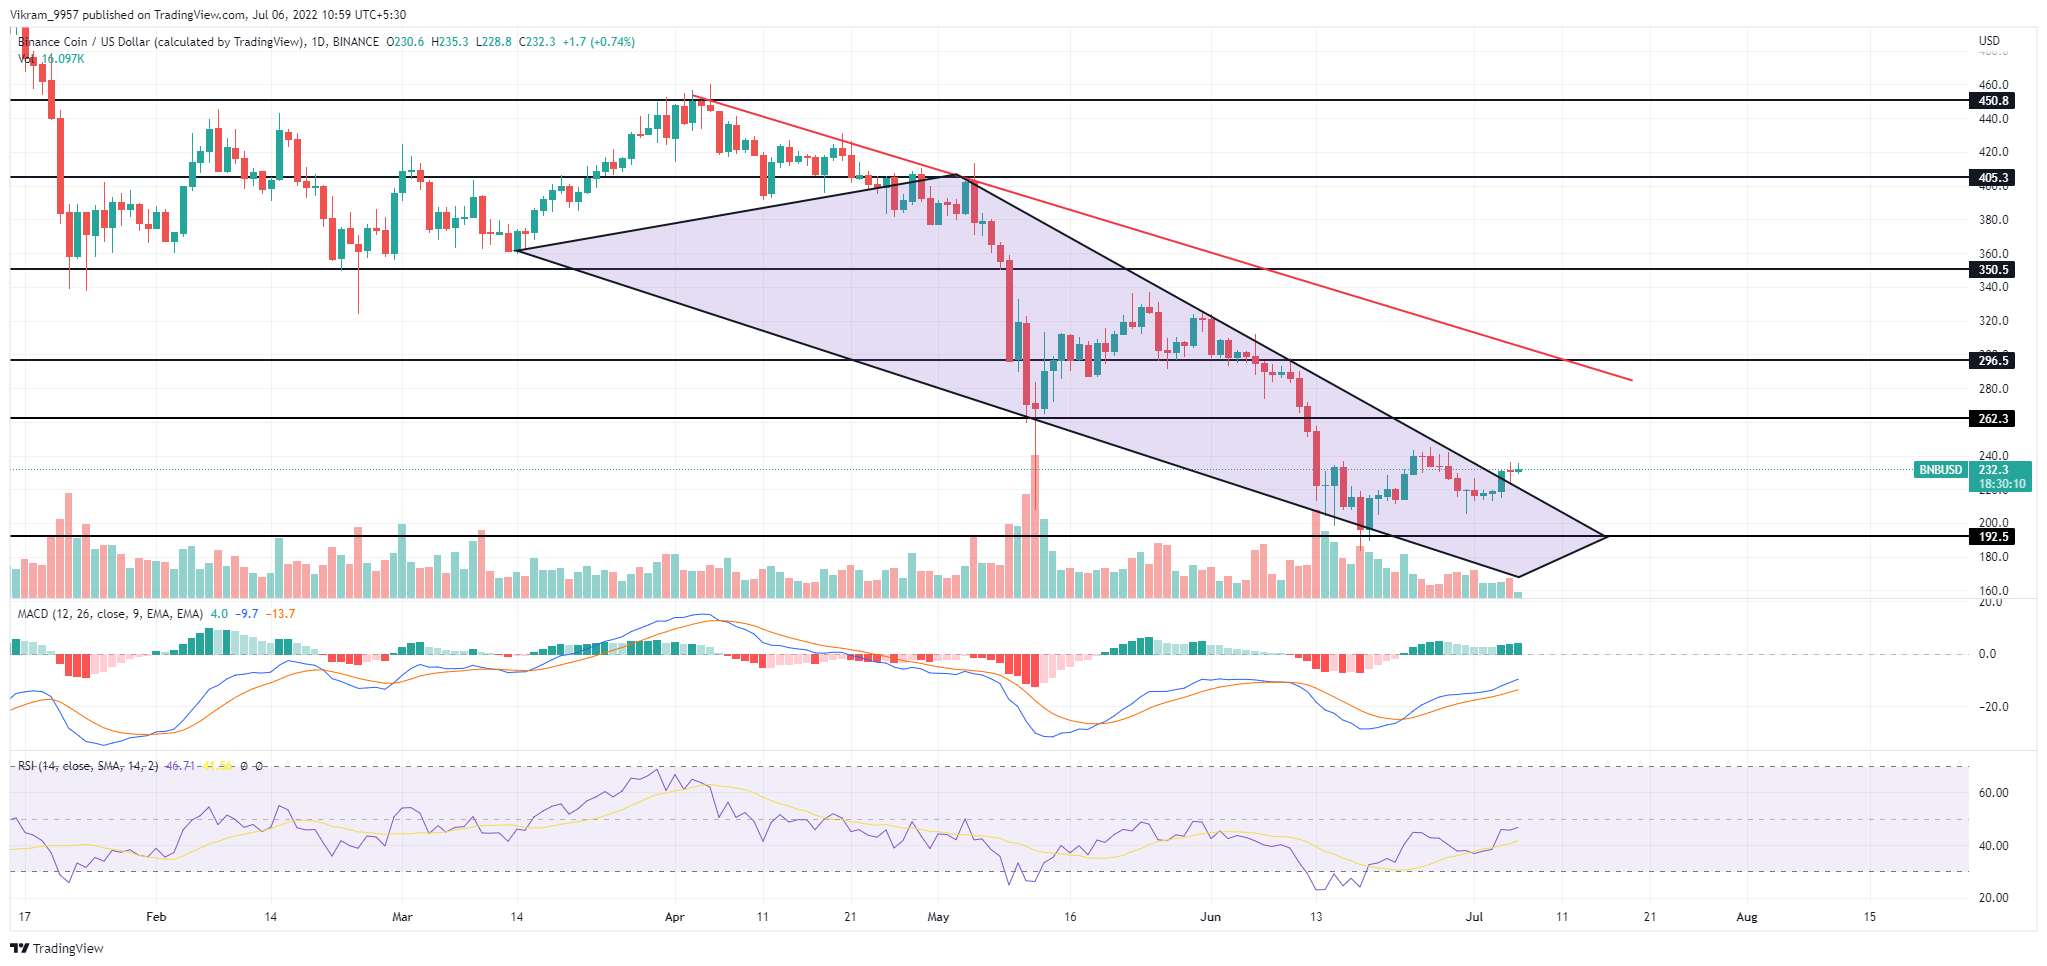
Source- Tradingview
BNB Technical Analysis
The 23% jump in the intraday trading volume showcases an increase in the bullish commitment. Hence, BNB traders can expect the breakout rally to reach the overhead resistance trendline. The MACD indicator showcases a phenomenal bullish Trend in the fast and slow line starting after the reversal rally surpassing the $200 mark. Hence the technical indicator projects a bullish trend in motion and teases a price jump to the $300 mark.
The RSI indicator displays a reversal from the oversold territory to the Halfway line indicating a rise in underlying bullishness. Moreover, the bullish support from the 14-day average line increases the likelihood of the RSI slope crossing above the halfway line. Hence the technical indicators Support the price action analysis and display a high probability of a prolonged uptrend. In a nutshell, the BNB technical analysis forecasts a double-bottom breakout rally propelling the market price dramatically.
Upcoming Trend
The breakout rally can launch the BNB prices above $262 to reach the overhead confluence of the resistance trendline and the psychological mark of $300. Conversely, if the prices fall under the $220 mark and fail to show a post-retest reversal of the broken resistance Trendline, it will nullify the bullish proposal.
Resistance Levels: $250 and $300
Support Levels: $225 and $200