


BSV Technical Analysis: Will The Downtrend Reach $40?


Table of contents
Key technical points:
Past Performance of BSV
For the past six months, the BSV price has been lowering under the influence of a descending trendline. Thus, multiple reversals from this dynamic resistance indicate the traders are actively selling at this trendline and have carried the downtrend to a new lower low of $45.67. However, the buyers have mounted support at $47m initiating a lateral walk.
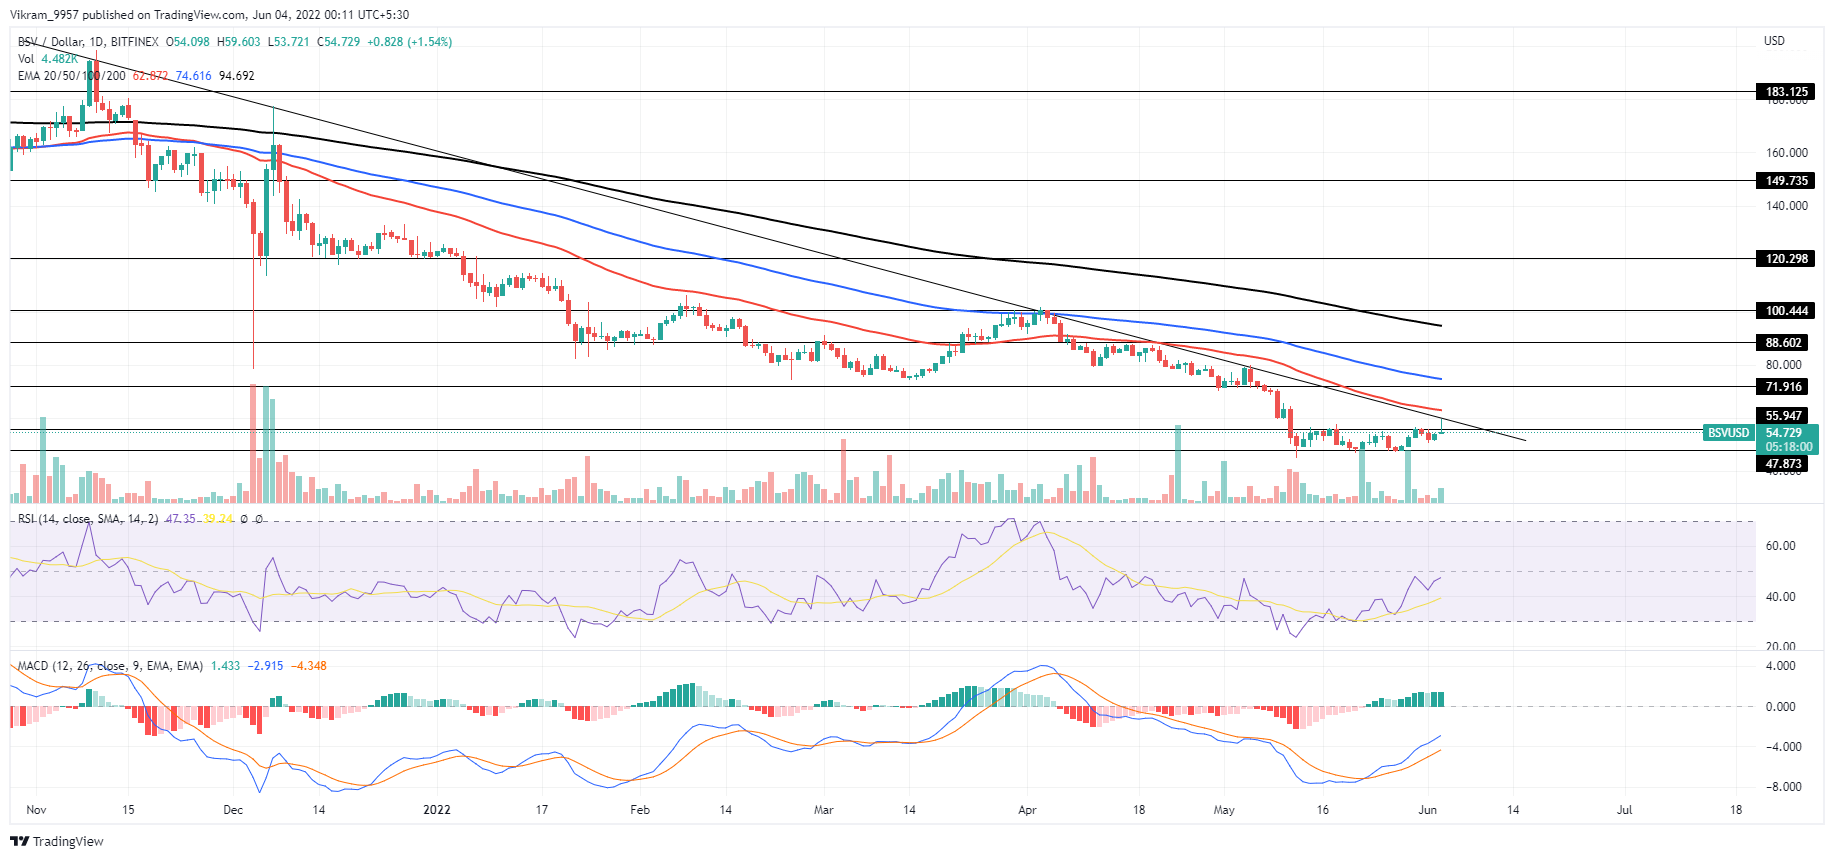
Source- Tradingview
BSV Technical Analysis
The BSV price has been wobbling between the $56.4 and $47 mark over the past three weeks, suggesting a minor consolidation phase. The recent price has driven the altcoin back to overhead resistance ($56.4), but the high supply pressure prevents a bullish breakout. Furthermore, a long-wick rejection attached to today's daily candle hints at reversal possibility. The RSI slope shows a gradual recovery from the oversold zone, surpassing the 14-day SMA and reaching the halfway line.
Furthermore, the MACD indicator shows the fast and slow lines avoiding bearish crossovers to maintain the uptrend in motion. In a nutshell, BSV technical analysis displays a high possibility of a retracement to $47.
Upcoming Trend
The expected reversal from the $56.4 resistance could slump the BSV price 13% lower to the $47 mark, indicating the range rally would continue for a few more sessions. However, this narrow consolation act as a no-trading zone and interest market participants should for its breakout to determine the following rally.
On the other hand, the fallout from the $47 support would sink the altcoin to $40 psychological support.
Resistance Levels: $56 and $65
Support Levels: $50 and $47