


BTC Technical Analysis: Will Bitcoin Escape The Consolidation Range?


Table of contents
Key Technical Points:
Past Performance of BTC
The BTC price action shows the extended consolidation range after the downfall of 40% from $31K to $19K between June 7th and 18th. The consolidation ranges between $19000 and $22000, and the recent reversal accounts for a 12% jump in the last seven days. However, the bearish candle with wick formation indicates a potential bear cycle starting within the range.
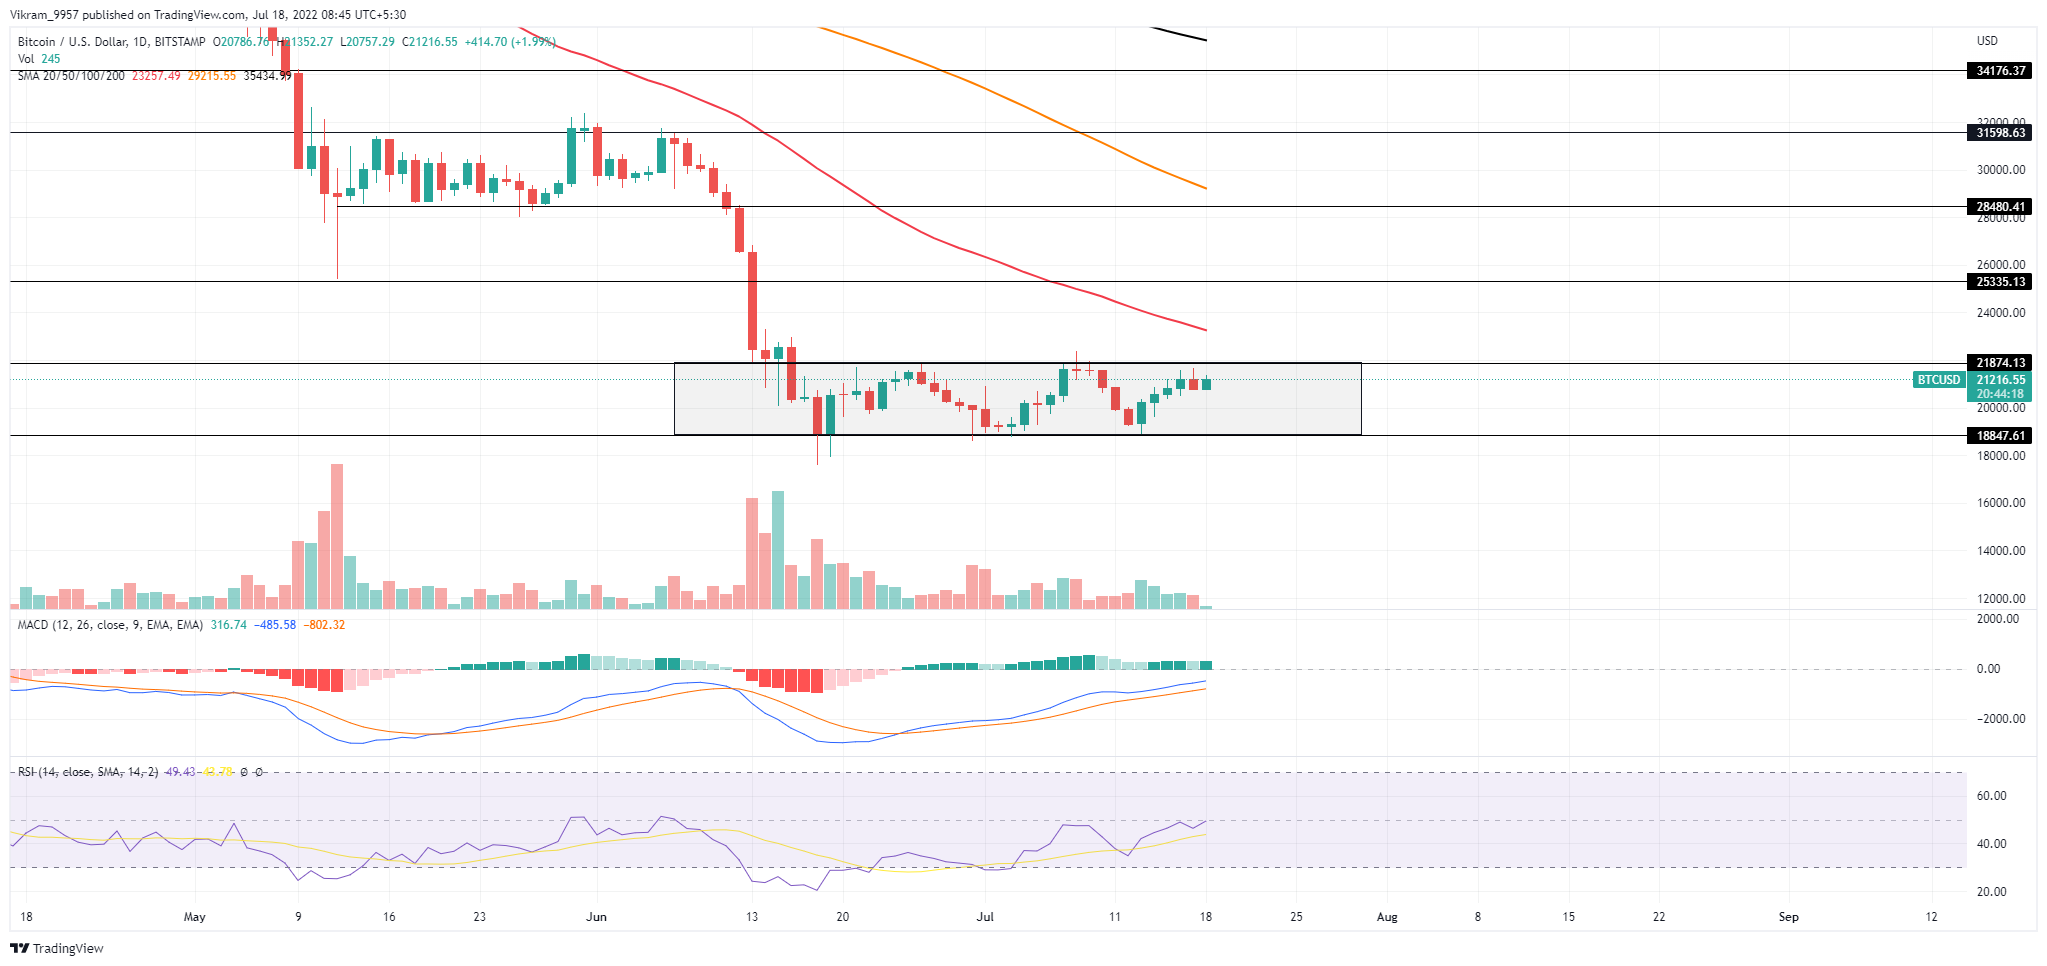
Source - Tradingview
BTC Technical Analysis
With the hopes of avoiding a bear cycle, BTC prices go green with the start of a new week. The price action shows a 2% growth on Monday, undermining the 1.86% drop a day prior. Hence, if the prices sustain the transition today, investors can expect bullish development escaping the consolidation range this week.
Taking the intraday volume into account, we can see a lack of bullish commitment during the recent bull cycle as its trend declines. However, as the prices try to undermine the bearish attempt, we can expect growth in buying pressure supporting the breakout rally.
The technical momentum indicators show a remarkable increase in the underlying bullishness as the fast and slow lines maintain a positive trend, with the RSI slope reaching the halfway line.
However, the breakout rally will have to face the overhead resistance of the 50 DSMA slightly above the $23,000 mark.
In a nutshell, BTC technical analysis showcases an increase in the underlying bullishness teasing a bullish breakout of the consolidation range.
Upcoming Trend
If the trapped bullish momentum escapes the consolidation range, investors can expect the breakout rally to face opposition at the 50-day SMA or the $25,000 mark.
On the other hand, a bearish reversal within the consolidation range will test the bottom support close to the $19,000 mark.
Resistance Levels: $21875 and $23258
Support Levels: $20000 and $18850