


CHZ Technical Analysis: Buyers Ready To Reclaim $0.30


Key technical points:
Past Performance of CHZ
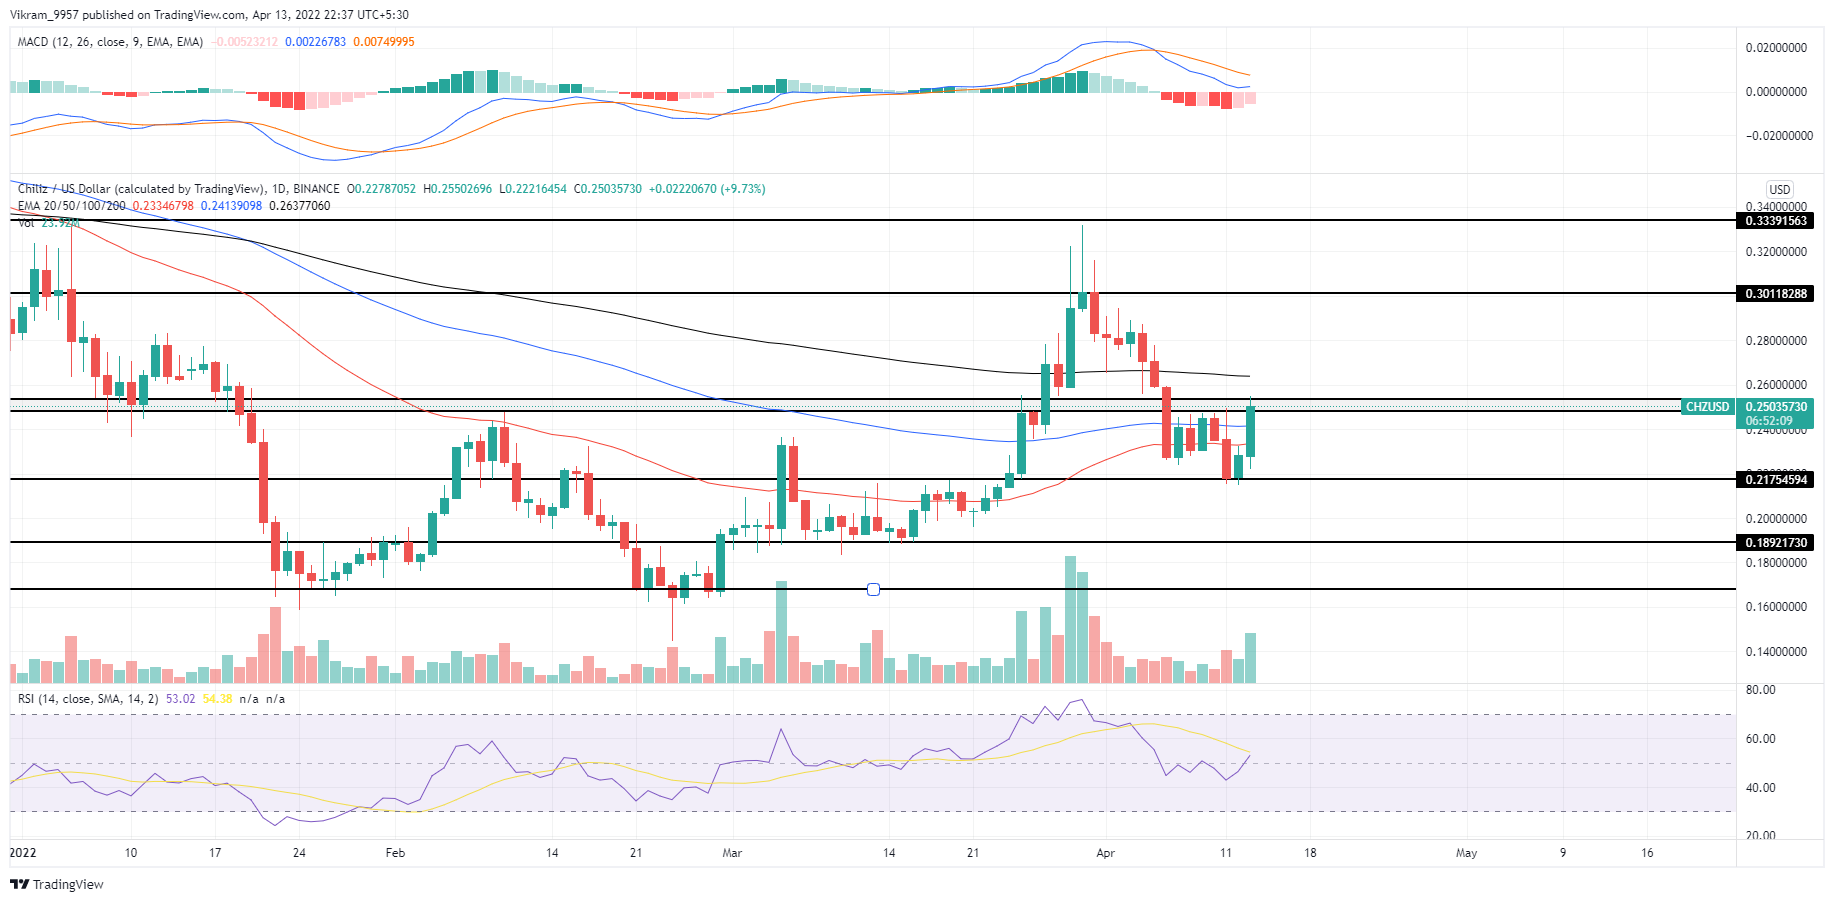
CHZ coin price retraced to the $0.21 support level after facing higher price rejection near the $0.30 mark, accounting for a fall of more than 25% within a fortnight. However, the bulls quickly turned the table, with a 12% rise in the last 48 hours and two consecutive daily bullish candles. However, the presently forming bullish engulfing candlestick faces a sudden supply inflow near the confluence of $0.25 and the 100-day EMA resulting in a potential wick formation.
Source-Tradingview
CHZ Technical Analysis
CHZ coin price action shows a sharp V-shaped reversal from the $0.21 level with a notable increase in trading volume representing the bullish commitment. However, the uptrend must surpass the supply zone to surpass the 200-day EMA and reclaim the $0.30 mark.
The lateral march of crucial EMAs(20, 50, 100, and 200) highlights a sideways rally for CHZ. However, the recent sell-off slumped the coin price below these EMAs, indicating the sellers are at a better advantage.
RSI Indicator: The RSI slope climbs back into bullish territory, suggesting a positive switch in traders' sentiment.
MACD Indicator: The narrowing gap between the fast and slow line projects the indicator may soon provide a bullish crossover. This potential buy signal gives additional confirmation for the $0.25 breakout.
In a nutshell, the CHZ technical analysis highlights the possibility of bulls reclaiming the $0.30 level.
Upcoming Trend
The CHZ/USD price chart shows a bullish reversal ready to reclaim the $0.30 mark and undermine the previous bearish trend. However, the supply zone at $0.25 remains a critical threshold that may trap the bullish momentum and crunch their rally before it starts. Hence, safe traders can wait for the price action confirmation to avoid speculation-based risks.
Support Levels: $0.21 and $0.18
Resistance Levels: $0.25 and $0.30