


CHZ Technical Analysis: Will Buyers Emerge Victorious Above $0.12?


Table of contents
Key technical points:
Past Performance of CHZ
With CHZ sellers taking over the trend control on May 12th, the 37% recovery with a sharp reversal from $0.09 broke above the $0.10 mark. However, the selling pressure above the $0.12 mark resulted in a retracement, eventually becoming a consolidation range above $0.10.
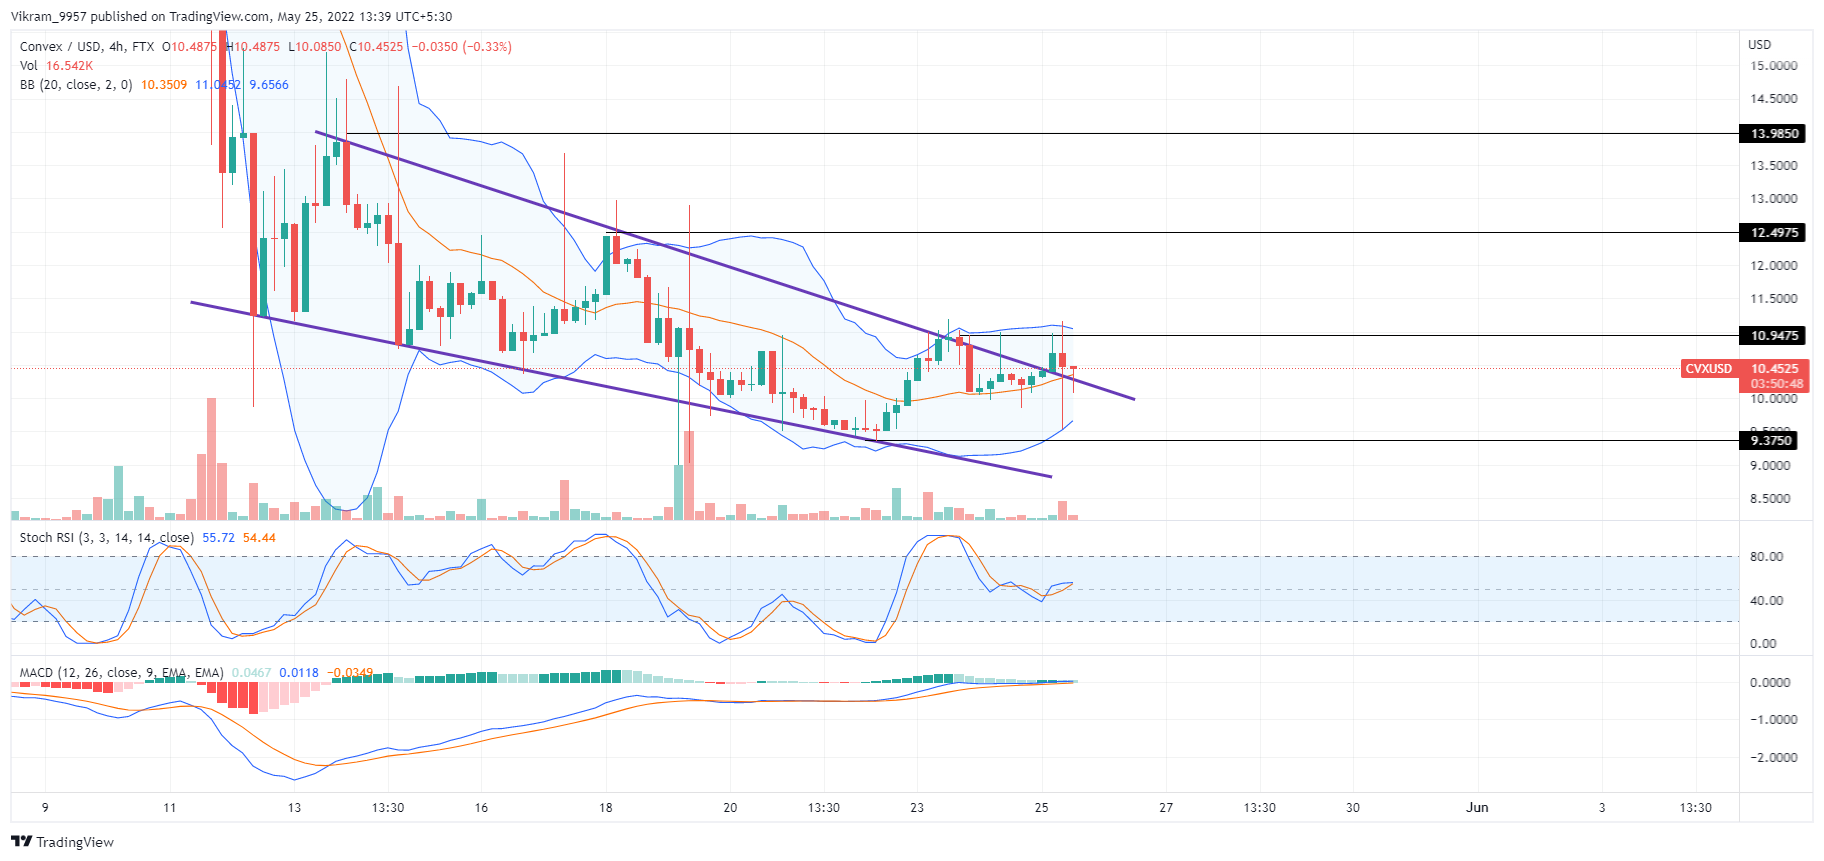
Source-Tradingview
CHZ Technical Analysis
The CHZ price shows a recent bullish failure to rise above the overhead resistance at $0.12, resulting in a retracement to the $0.10 support level. However, the Bollinger bands project a possible start of the expansion phase after maintaining a long-coming sideways trend.
The Stochastic RSI shows the K and D lines in an uptrend, struggling to maintain the bullish trend in the neutral territory as the spread decreases. Hence, the possibility of a bearish crossover teasing the consolidation fallout increases.
On the other hand, the MACD and signal lines merge slightly below the zero line after a long-coming downtrend crossing under the zero line. Hence, the crossover hints at starting a bullish trend in the MACD histograms promoting the bullish breakout possibility.
Hence, the CHZ technical analysis displays a consolidation breakout possibility leading to a high-momentum trend.
Upcoming Trend
The breakout rally will drive the CHZ prices to the $0.17 mark if it surpasses the $0.15 accounting for a price jump of 35%. However, a bearish takeover will result in a fallout of $0.11 and reach the $0.095 mark.
Resistance Levels: $0.15 and $ 0.17
Support Levels: $0.11 and $0.095