


DOT Technical Analysis: Back At $10, DOT Holders Get Nervous


Key technical points:
Past Performance of DOT
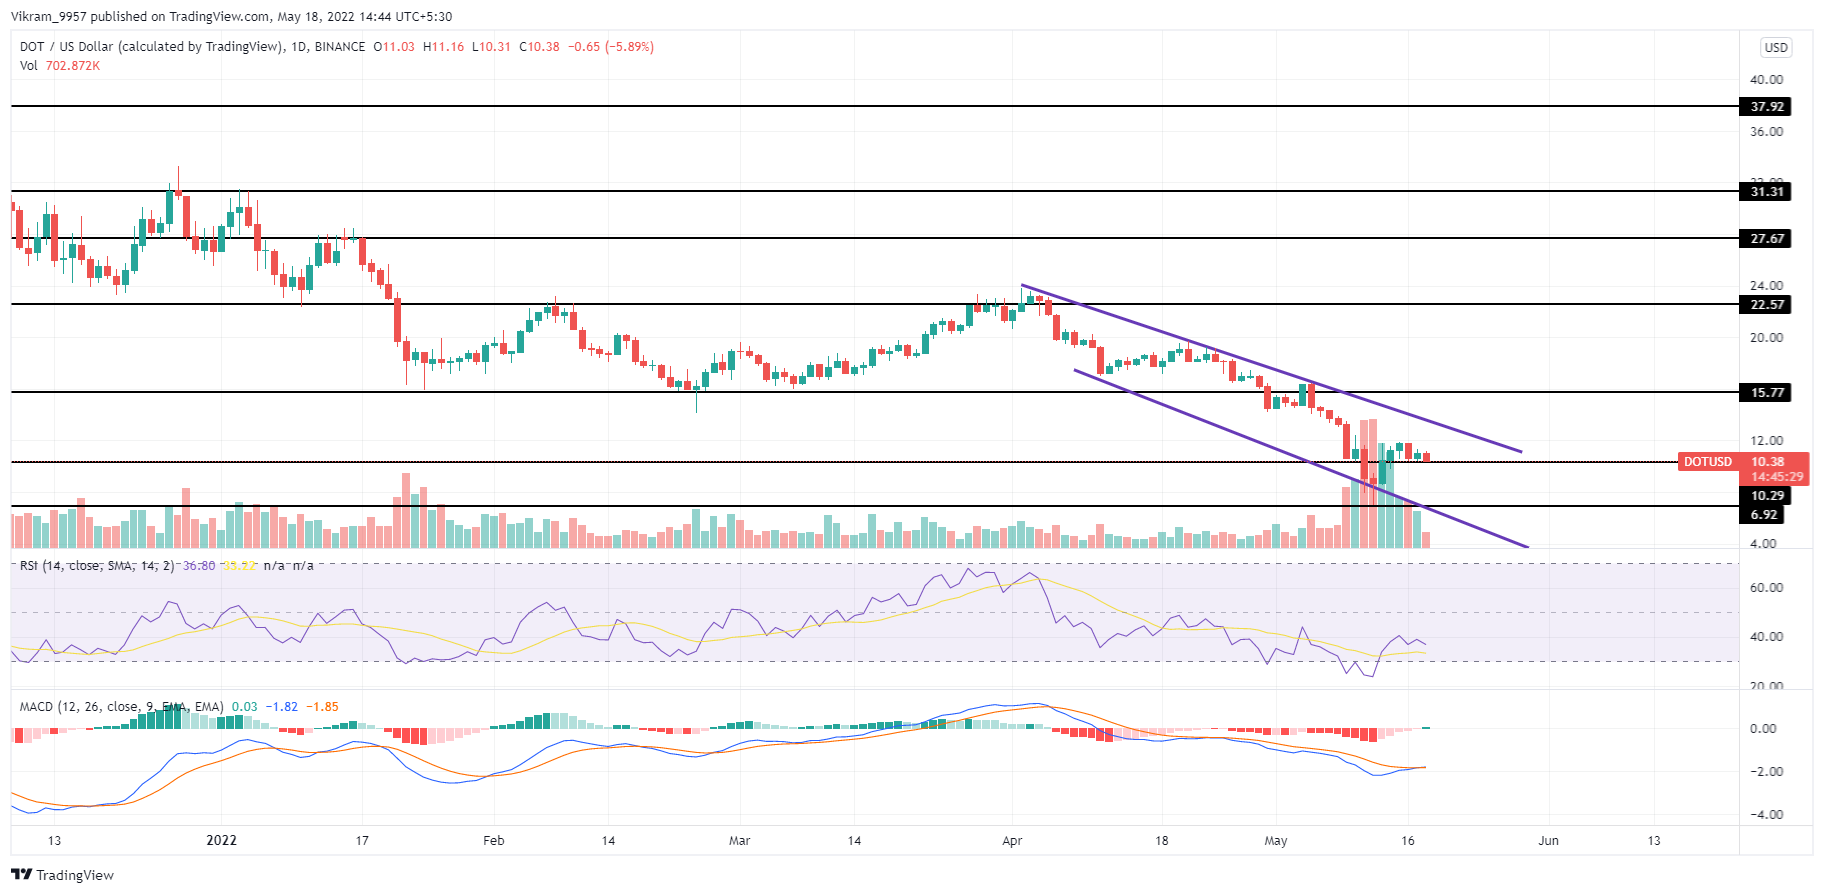
The falling channel in the DOT prices showcases a correction phase driving the overbought prices under the market value. Starting from the top of the falling channel at $22.85, the downtrend breached the $10 barrier but currently resurfaces above it.
Source-Tradingview
DOT Technical Analysis
DOT prices showcase a flattish trend with growing bearish influence above the psychological barrier of $10. However, the falling trend in volume reflects the liquidation of high-leverage positions and brings stability to the price trend. This keeps a neutral motive till the actual price develops.
The falling trend in the crucial 50, 100, and 200 EMAs continues in a bearish manner due to the recent loss of an upward-looking crossover. The 50-day EMA returns to the 100-day ESMA and the beginning of a falling channel.
The downtrend in the RSI slope (blue line) shifts into neutral gear below the halfway line after crossing above the 14-day SMA. As for the MACD indicator, the gradual reversal in the fast line merges with the signal line in the negative territory.
Hence, the technical momentum indicators in DOT/USD chart show a gradual rise in underlying bullishness, but the question of its sustenance still stands.
Upcoming Trend
Considering the liquidating positions were bearish, it will long-squeeze the DOT prices higher above the $10 mark and hit the 50-day EMA at $15. However, a fall under $10 will retest the $7 mark.
Support Levels: $10 and $7
Resistance Levels: $12 and $15