


DOT Technical Analysis: Bearish Patterns Arise In Multiple Timeframes


Key technical points:
Past Performance of DOT
Prices for DOT fell 60% in the past two months, resulting in the breakout at $10 following resistance near the $23 level. However, the downfall did find support at $7, resulting in the evening star pattern that resurfaces the market value higher than $9. But, the trend of decline persists and is a warning of falling to test the low of $7.
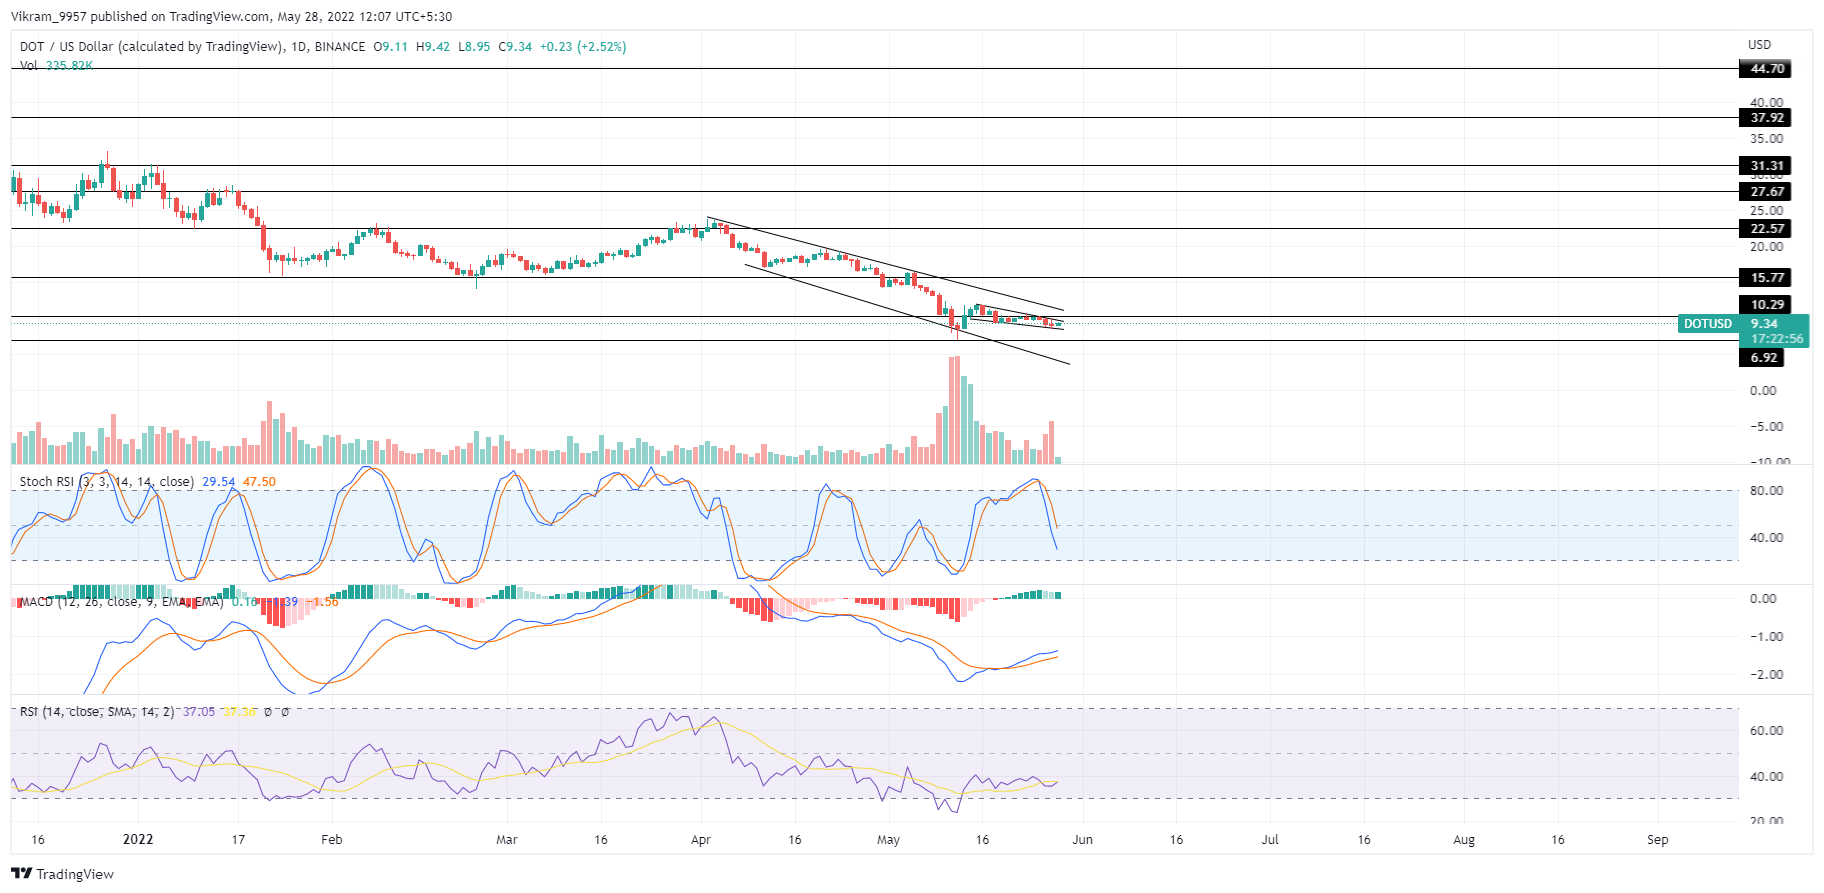
Source-Tradingview
DOT Technical Analysis
A falling trend shows a contraction in the price range in the 4-hour chart, leading to a falling wedge pattern. The bearish patterns support the overall movement in the more considerable timeframe reflecting a high possibility of a downfall.

Source-Tradingview
The MACD and the RSI indicators suggest the possibility of an upside breakout of the falling wedge. This is because of the bullish divergence in the RSI and the ongoing upward trend in the MACD and signals lines.
Siding with sellers, the Stochastic RSI indicator displays the K and D lines dropping below the overbought area following the bearish crossover, marking a selling spot. Therefore, the indicator shows a high possibility of a bearish breakout of the falling wedge.
In a nutshell, the DOT technical analysis projects a bullish attempt within the falling wedge.
Upcoming Trend
Suppose the morning star pattern is formed successfully in the falling wedge; the bullish reversal will test the overhead resistance trendline close to $11. However, a downtrend continuation will test the bottom of $7.
Resistance Levels: $10.5 and $11
Support Levels: $7.5 and $7