


DOT Technical Analysis: New Trendline Contains The Breakout Rally


Table of contents
Key technical points:
Past Performance of DOT
With the sell-off driving DOT market value down by 60% in April and May, the price action forms a falling channel in the daily chart. The downfall cracks under all the crucial EMAs and the $12 support to create a base at $8.75. Buyers capitalize on the bullish base formation to retest the $12 fallout before restarting the prevailing trend under the influence of a new resistance trendline.
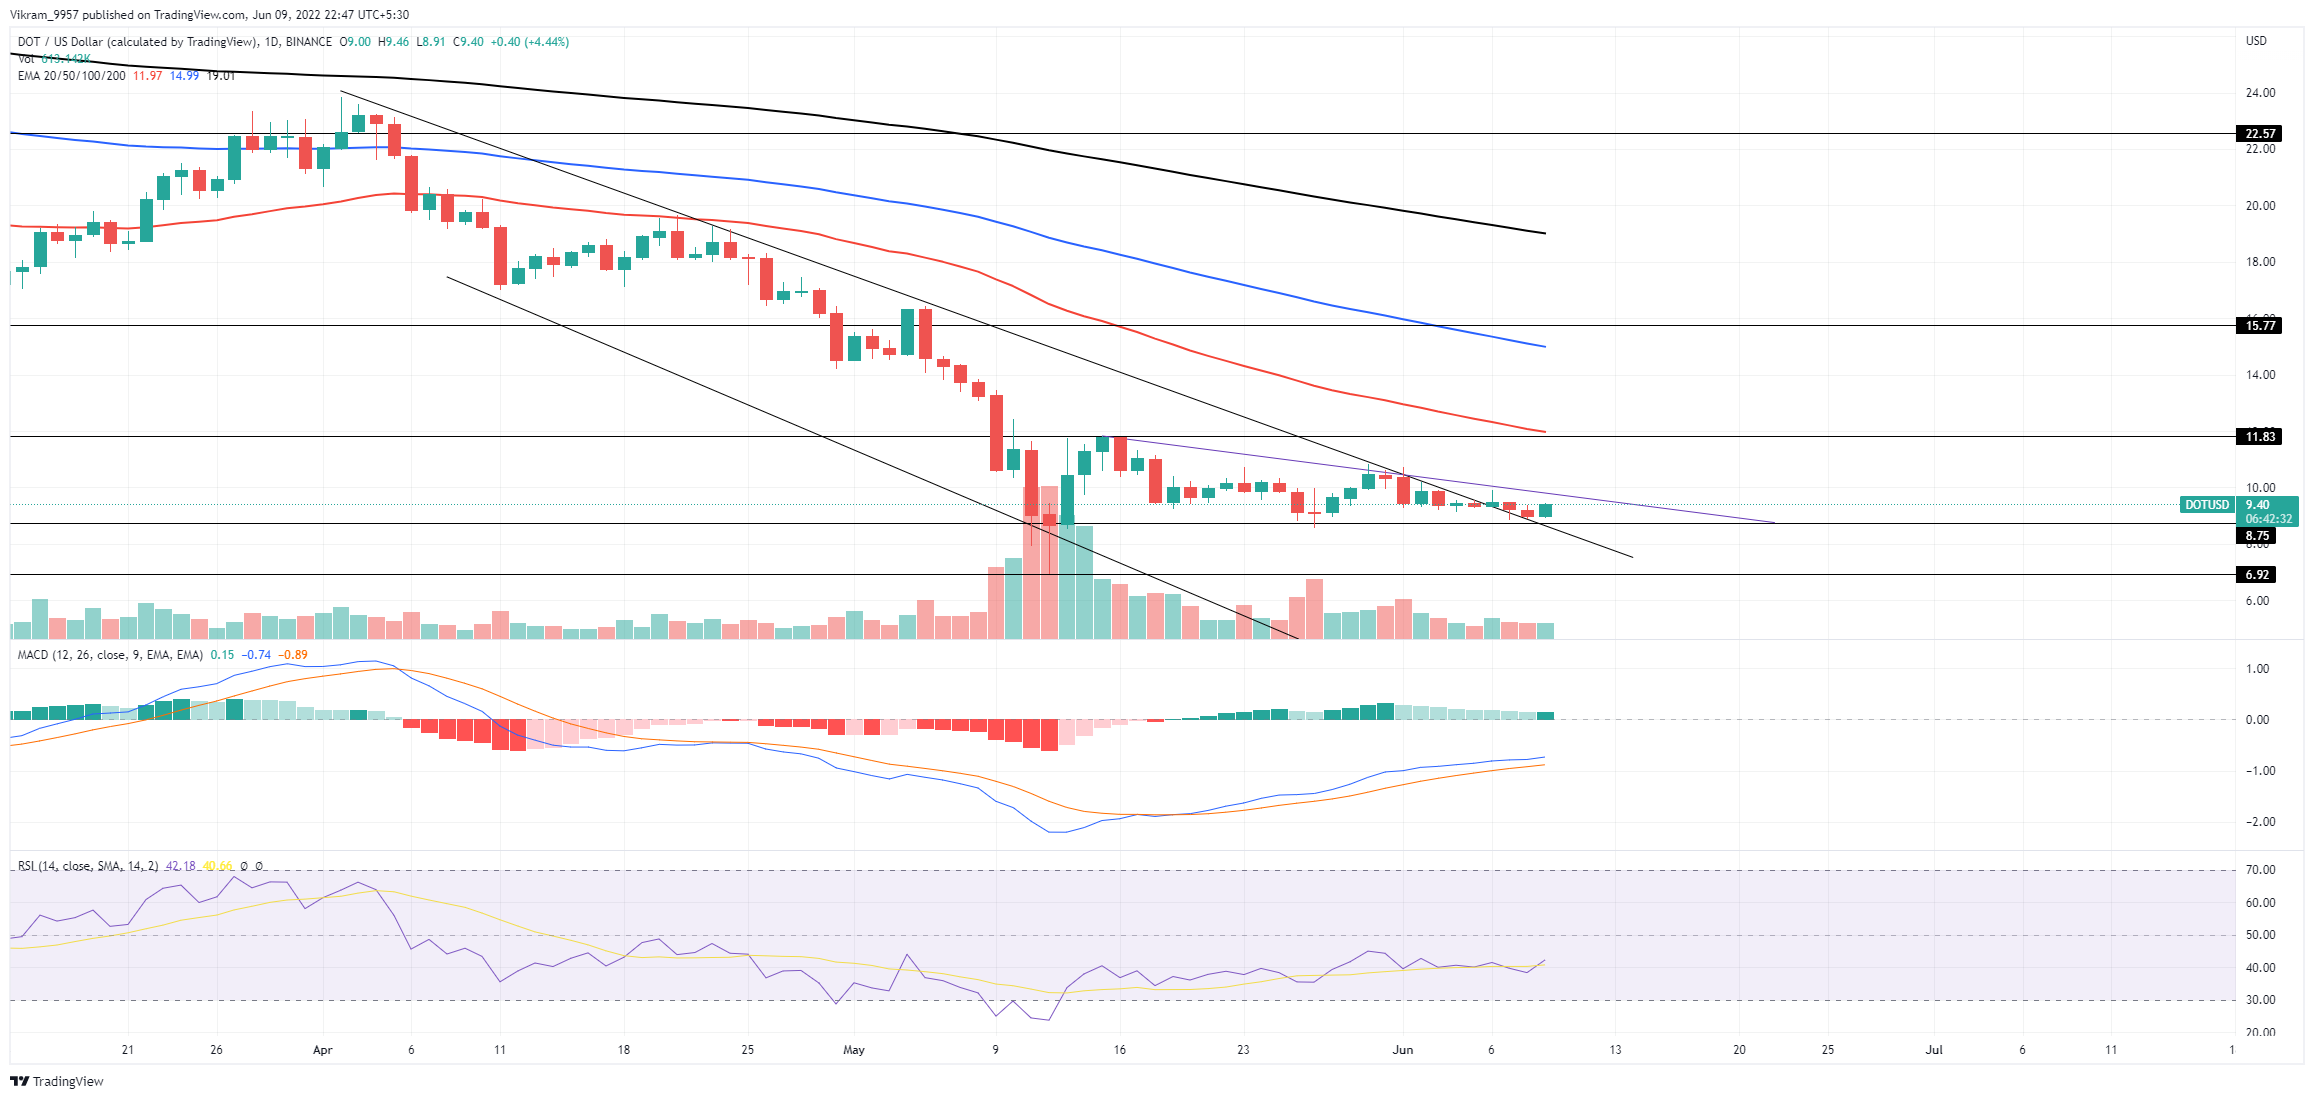
Source- Tradingview
DOT Technical Analysis
As mentioned in our previous article, Dot prices surpass the falling channel but the DOT prices struggle to reach $12. This is because the breakout rally faces bearish opposition from the new resistance trendline. Hence, the breakout of the new trendline will provide an entry spot for buyers. The three EMAs crucial for daily trading 50, 100, and 200-days remain in a bearish trend, representing the long-term correction rally. Moreover, the breakout rally will have to overcome the selling pressure on the EMAs to ensure the uptrend sustains.
The MACD and signal lines display an uptrend and recently avoided a bearish crossover with the bullish momentum resurging in the MACD histograms. This indicates a new buying spirit in action increases the likelihood of a bullish continuation. Additionally, the RSI indicator displays a sideways trend floating above the 14-day SMA within the nearly oversold zone. Therefore, the technical indicator shows a growing bullish influence on the retracing trend. In short, DOT technical analysis highlights the potential bullish breakout of the descending triangle.
Upcoming Trend
If the bullish influence grows over the triangle, the DOT price will surpass the descending trendline resulting in a price jump to $12. However, the breakdown of the base of the triangle will lead to a price fall to $7.
Resistance Levels: $10 and $12
Support Levels: $8.75 and $7