


DOT Technical Analysis: Will This Breakout Rally Exceed $10?


Table of contents
Key Technical Points:
Past Performance of DOT
As mentioned in our previous analysis, the DOT price took a bearish reversal from the resistance trend line to test the ultimate support of $6.55 in the daily chart. However, a bullish reversal with a Morning Star pattern exceeds a resistance trendline and accounts for a 30% jump in the last four days. The breakout rally approaches the $8.75 resistance level projecting a high likelihood of a bullish breakout.
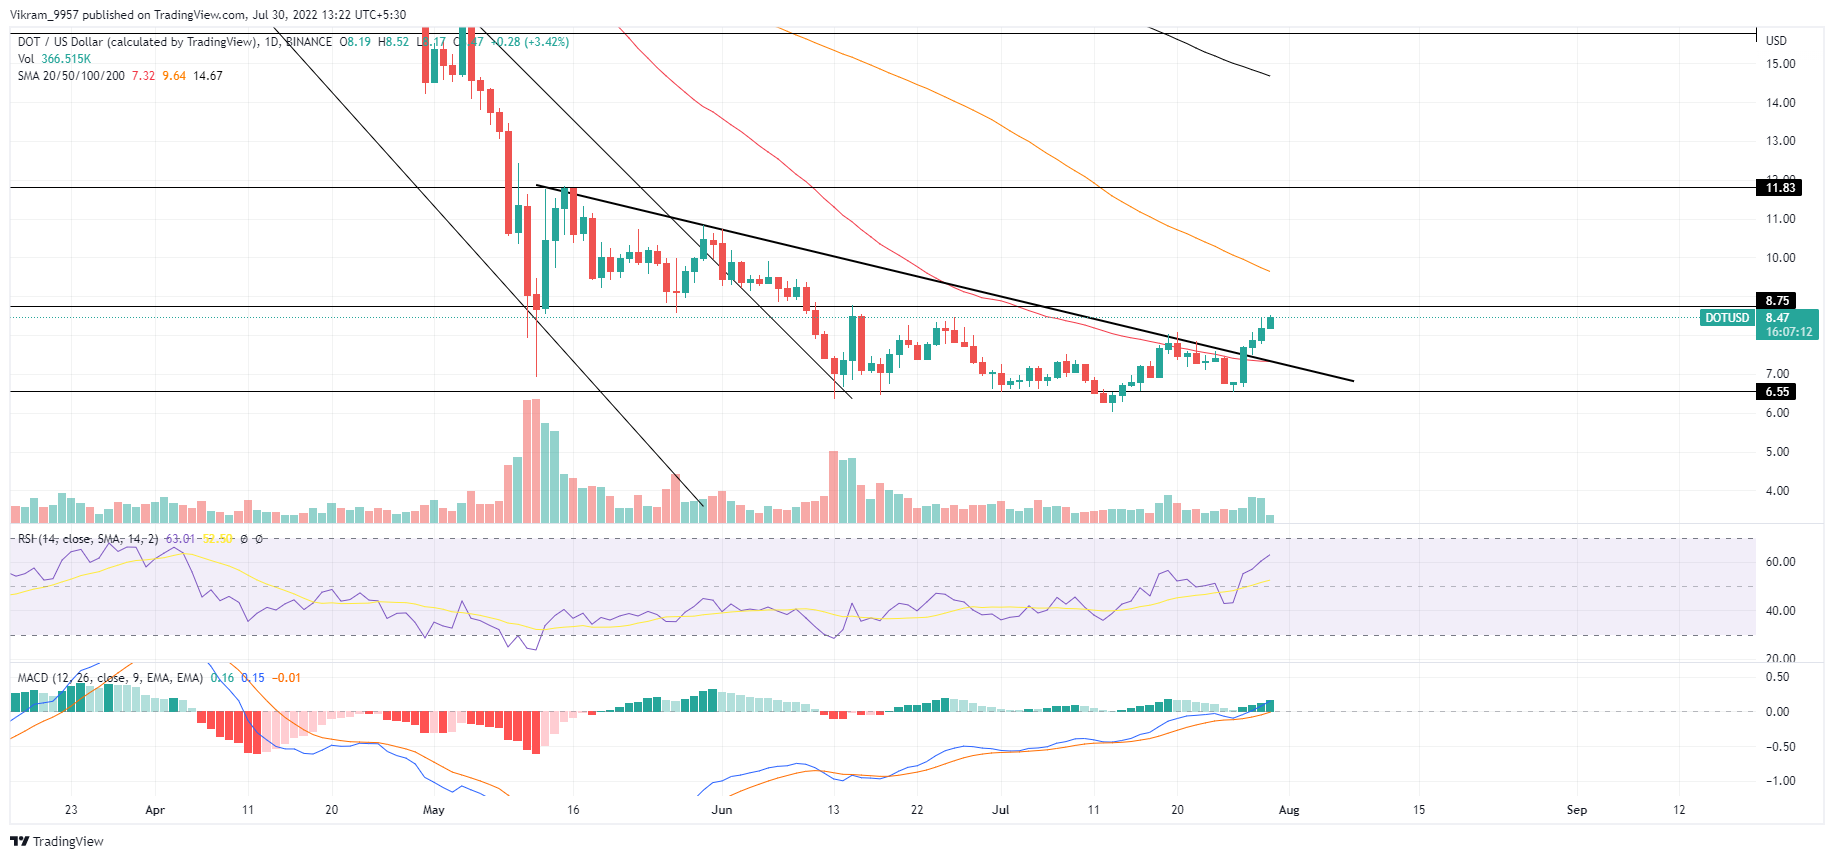
Source - Tradingview
DOT Technical Analysis
The bullish breakout rally gains momentum as the intraday trading volume spikes represent a boom in buying pressure. Hence traders can shortly expect a breakout entry spot generating with the market value surpassing the $8.75 mark.
As the market price exceeds the 50-day SMA, the next bullish target for the uptrend becomes the 100-day SMA close to the psychological mark of $10.
As the breakout rally gains trend momentum, the RSI slope spikes in the nearly overbought zone representing an increase in the underlying bullishness.
The MACD indicator shows a bullish trend continuation in the fast and slow lines as the buying pressure increases. Hence the technical indicators represent an increase in the underlying bullish sentiments, increasing the likelihood of an apparent continuation.
In a nutshell, the DOT technical analysis showcases the technical indicators strengthening the bullish bias.
Upcoming Trend
If the DOT prices break above the $8.75 resistance level, the likelihood of an uptrend continuation above the 100-day SMA increases drastically. Hence traders can expect the breakout rally to reach $11.83 after surpassing the psychological mark of $10.
Conversely, if the bullish rally fails to exceed $8.75, a retracement to retest the resistance trendline seems inevitable.
Resistance Levels: $8.75 and $10
Support Levels: $8 and $6.5