


DYDX Technical Analysis: Falling Channel Influences 20% Formation


Key technical points:
Past Performance of DYDX
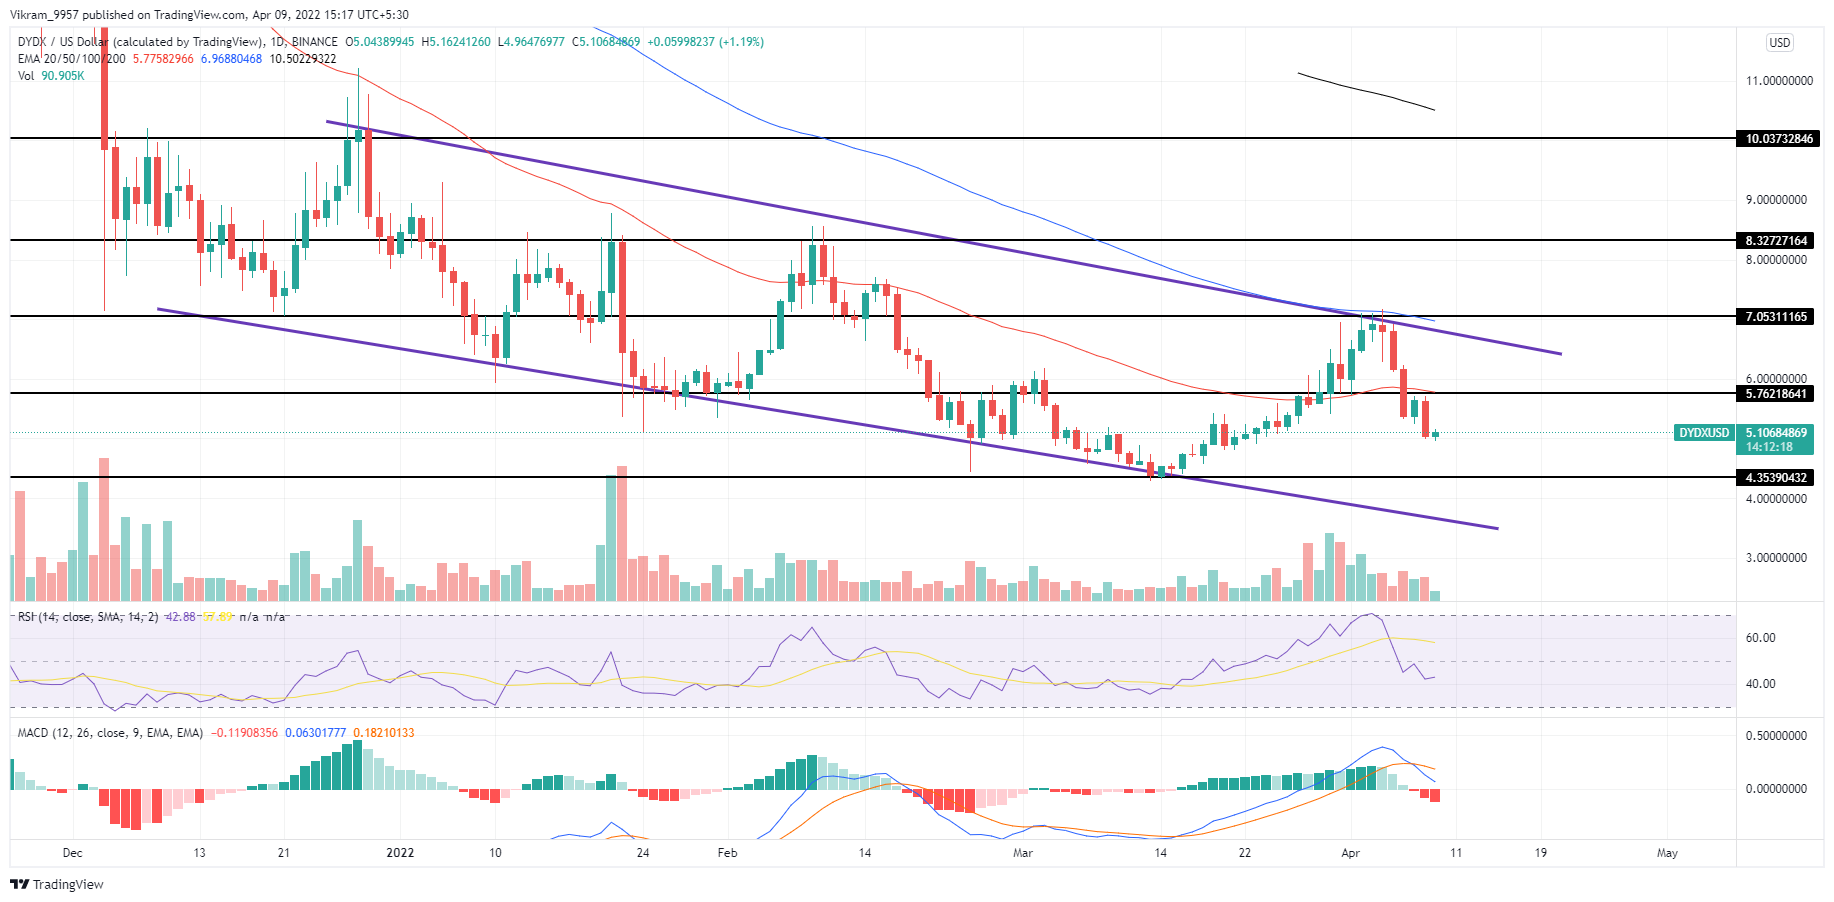
DYDX coin price action shows a bearish trend in action in a falling channel fashion starting from the $10 fallout. Moreover, the 50 and 100-day EMA keeps the bullish growth trapped under the falling channel. The downtrend accounts for a 50% fall in the last three months and also tests the $4.35 falling trend.
Source-Tradingview
DYDX Technical Analysis
DYDX coin price shows a recent rejection from the confluence of the resistance trendline and the 100-day EMA resulting in a 28% fall in the last 96 hours. Moreover, the fall instigates the fallout of the $5 barrier and teases a 30% fall to the support trendline.
The crucial daily EMAs (50, 100, and 200 days) keep a bearish alignment with the 100-day EMA inducing increased outflow and maintaining the trend trapped under the channel. Hence, the EMAs supply to support the bullish growth in check.
RSI Indicator: The RSI slope shows a rounding reversal from the overbought boundary and breaking below the 50% mark within a few days. Hence, the RSI values approaching the oversold zone reflect increased selling pressure.
In a nutshell, the DYDX technical analysis emphasizes the likelihood of freefall to the support trendline.
Upcoming Trend
DYDX coin price experiences an increased fear among investors as the prices fall within the parallel channel. Hence, the chances of a downtrend to the support trendline are increasing with the $4 fallout.
Support Levels: $4.35 and $3.70
Resistance Levels: $5.75 and $7