


ENJ Technical Analysis: Between Fibonacci Levels, Situation Intensifies


Table of contents
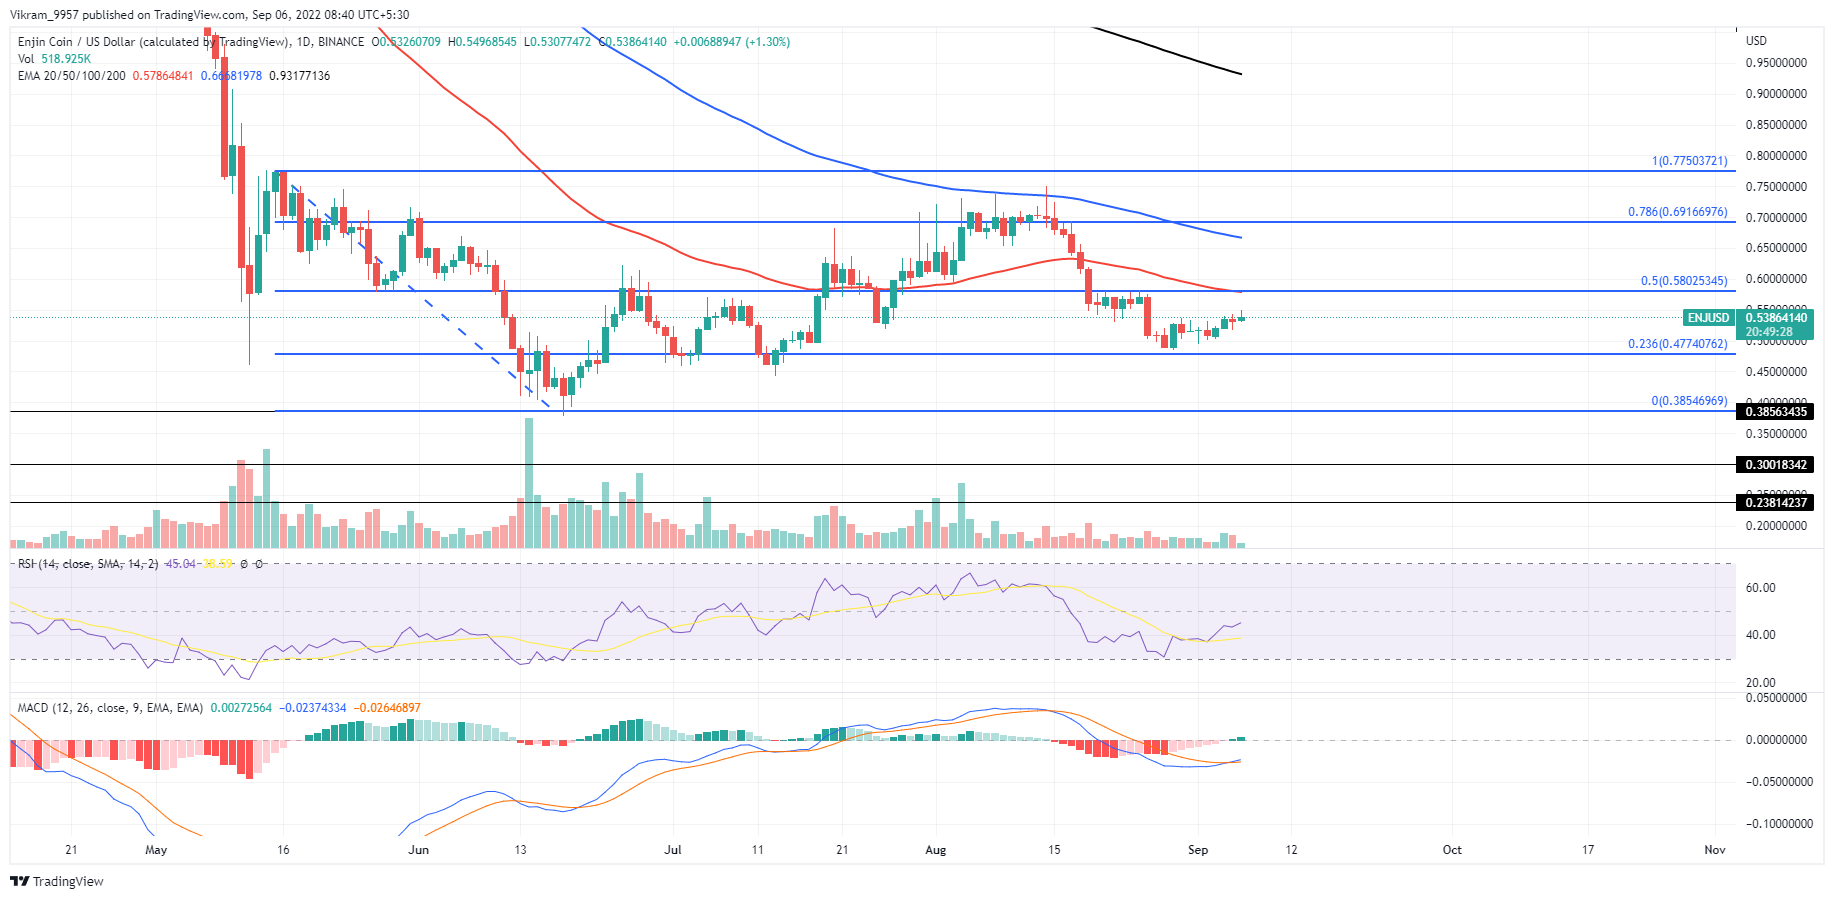
ENJ shows a bullish reversal from the 23.60% Fibonacci level, slightly below the $0.50 psychological mark. The reversal rally prolongs the consolidation range below the 50% Fibonacci level at $0.57. Will the consolidation lead to a bullish breakout to the $0.68 mark?
Key Points:
Source - TradingView
ENJ Technical Analysis
The ENJ price shows a bullish reversal from the 23.60% Fibonacci level after the recent bearish phase. Moreover, the reversal rally accounts for a price jump of 12.25% over the last week and approaches the 50% Fibonacci level at $0.57.
The increased intraday trading volume supports the bullish reversal raising the uptrend possibility. Furthermore, the uptrend may break above the resistance confluence of the 50-day EMA and 50% Fibonacci level.
Additionally, the sideline buyers can expect the breakout rally to reach the overhead assistance of $78.60 Fibonacci level close to the $0.68 mark.
On a negative note, a bullish failure will prolong the consolidation of ENJ prices between the $0.46 and $0.57 horizontal levels.
Technical Indicators
The daily RSI slope shows a bullish reversal from the oversold boundary, crossing above the 14-day SMA and approaching the halfway line. Furthermore, the MACD indicator shows a bullish crossover in the fast and slow lines signaling a bullish entry opportunity as the buying pressure increases. Hence, the technical indicators maintain a positive outlook and expect the ENJ prices to exceed the $0.57 mark.
Resistance levels- $0.57 and $0.68
Support levels- $0.46 and $0.37