


ETC Technical Analysis: One Step Before The Reversal


Table of contents
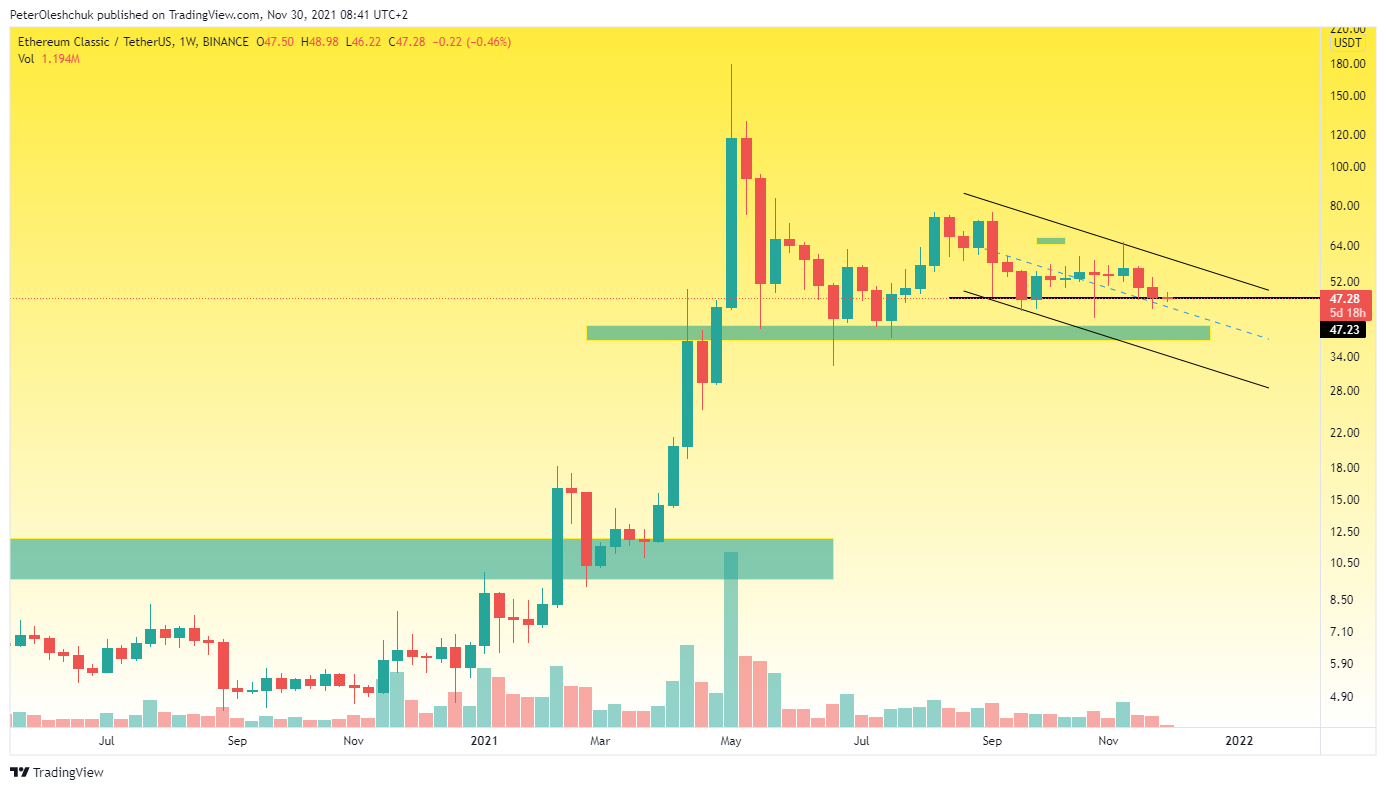
The critical point of the ETC market is still in the global range of $37-$40. The test of this liquidity zone for us is a negative scenario that puts the strength of buyers at risk. The best-case scenario for the continued ETC market growth would be to stop the price at around $47.23. At the time of writing, sellers are just testing this mark. Closing the weekly candle above this mark will open the way for buyers to form a local reversal of the ETC price.
In this scenario, the first target of buyers in the weekly timeframe is at $56. This mark shows a serious level of resistance and a trend line of sellers. For those investors who like to enter the market more conservatively, it is safe to buy ETC only after breaking and fixing the price above the $56 mark.
Technical Analysis Of ETC On The Daily Timeframe

Analyzing the ETC price movement on the daily timeframe, you can see the passivity of buyers near the critical local mark of $56. If the first blow of sellers buyers met confidently, now the trading volumes during the growth attempt are extremely small. Compare them with the trading volumes from 24 November. Yes, buyers could not organize a deep rebound, but at least showed interest. At the moment, sellers are simply pushing the price below the liquidity level and do not feel resistance. Therefore, if the BTC price falls to the range of $52,000-$53,000, the ETC market will most likely test the mark of $47.23.
The ETCBTC Price Has Stopped Near The Global Level

However, looking at the global outlook for the ETCBTC market is getting a little calmer. For 9 weeks, the ETCBTC price slows down near the global range of 0.00072-0.00078. Buyers are not even allowed to re-test this range after the weekly candle from 25 October. We also do not see high volumes from sellers - so there is no aggression. Therefore, we expect the completion of the correction of the BTC market, which will create favorable conditions for the formation of a new growth wave with the first target of 0.002.