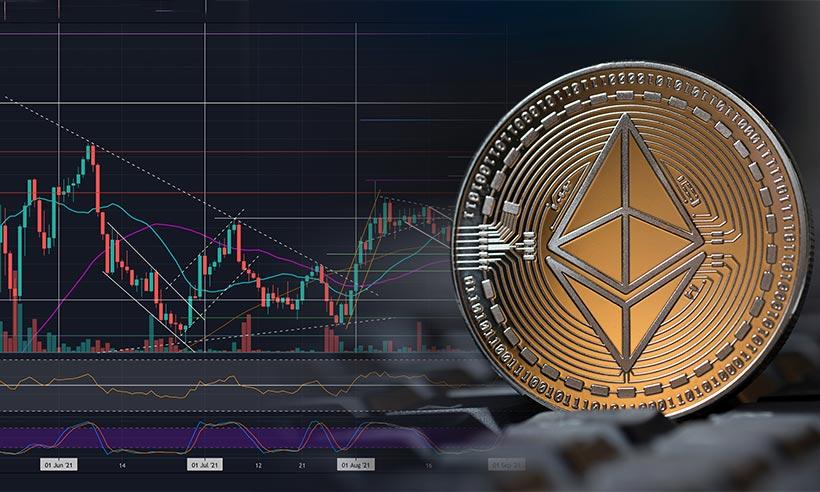
Let us see the technical analysis of ETH.
The coin is trading at $4130 and was trading at $4388 two days back. Ethereum generated substantial momentum throughout 2021, none more important than the continued updates to Ethereum 2.0. The most important of 2021 was the recent release on December 1, 2021, in the form of the Beacon Chain. The Beacon Chain is one of the final steps to convert Ethereum from Proof-of-Work to Proof-of-Stake.
Relatively muted price action should be expected for Ethereum price. A slow movement towards higher to hit one of the three price movements around the $7,400, $9,400, or $10,900 value areas around mid-June to July 2022 is expected.
The On-balance Volume is at 63 million going in an upwards direction. This shows the uptick in volume is in line with the prices.
RSI is at 43%, still very low and near the oversold zone. It is moving upwards and creating the momentum for prices to be a little bullish. We can see this as a support zone for the price as of now.
The MACD lines are now separating and staying above the histogram and moving above zero. The MACD line (fast line) is still above the Signal line (slow line) and is following the trend of an overall increase in prices. The oscillator has given a clear uptrend in prices.
The monthly technical indicators and moving averages for the cryptocurrency suggest 4 sell and 10 buy recommendations for ETH. Weekly technical indicators and moving averages suggest 11 buy and five sell signals. From a technical perspective, $4,530 remains a key level of support for Ethereum in the short-term, as well as $4,370.