$ 96,258.6
BTC
-0.45 %
$ 1,842.15
ETH
0.33 %
$ 0.7069
ADA
1.81 %
$ 599.72
BNB
-0.31 %
$ 147.64
SOL
-0.11 %

Ankita Awasthi
Dec 20, 2021

ETH Technical Analysis: Key Resistance of $4000 Yet to be Broken, Buy for Long-Term

ETH
Ethereum (ETH) is an open-source cryptocurrency and currently the second-largest cryptocurrency in terms of market capitalization. Among the functions that drove this cryptocurrency to that position is its technology, specifically the GAS. This system prevents errors and accidents during the different processes to occur in the Ethereum network. In addition, it serves to measure the effort and steps required by each computational process.

Let us see the technical analysis of ETH.

Past Performance of ETH

Ethereum generated substantial momentum throughout 2021, none more important than the continued updates to Ethereum 2.0. The 2021 returns have been 400% in ETH. Moreover, in the previous week, the price has fluctuated between a low of $3,664.72 and a high of $4,110.37. And, it has fallen by 2% during the last 24 hours. The traders are not worried about a 20% drop from the $4,870 all-time high.

TradingView Chart

ETH Technical Analysis

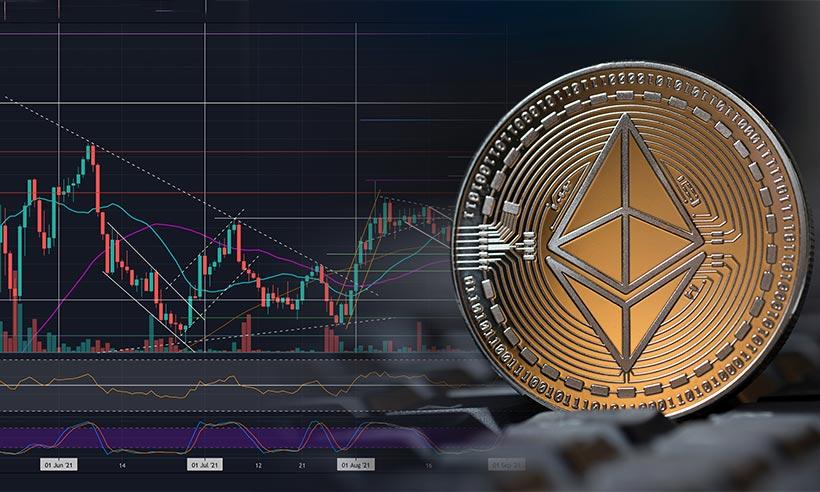
At the time of writing, the coin is trading at $3848 and has been falling since last week. In the daily chart, relatively muted price action should be expected for Ethereum price. A slow movement towards higher to hit one of the three price movements around the $7,400, $9,400, or $10,900 value areas around mid-June to July 2022 is expected. However, these predictions will come about only after it crosses the near resistances. The recent price actions show an eagerness to return above $4,000, which remains the key level for ETH.

The On-balance Volume is at 63 million, going in an upwards direction. This shows the uptick in volume is in line with the prices.

RSI is at 42% and moving downwards. Therefore, the bullish momentum is simply not there to succeed in making a significant move out of the current consolidation area.

The MACD lines are now separating and staying below the histogram and much below zero. The MACD line (fast line) is below the Signal line (slow line) and is following the trend of an overall decrease in prices.

Price Trends for the Next Few Days

ETH appears to be at a crossing point for the next few days. The steadiness of the current price action will likely lead to an uptick in volume for this week's trades, as ETH breaks away from the current support or resistance consolidation levels. Until that happens, expect to see ETH just around the $4,000 mark in the next few days. Right now, the overall sentiment has turned neutral over the weekend, and it remains to be seen what the hodlers can expect the price to be. A great time to buy-in.

ETH Technical Analysis: Key Resistance of $4000 Yet to be Broken, Buy for Long-Term
Ankita is reading geek by birth, she loves to read and write about finance and now cryptocurrencies and blockchain since 2017. A Bitcoin enthusiast ever since, she likes to understand businesses and how they affect everything else. Ankita contributes on our news bulletin with the latest happening in blockchain, crypto and ICO market specifically.
Top Picks