


FTM Technical Analysis: FTM Buyers Under Bearish Chokehold


Key technical points:
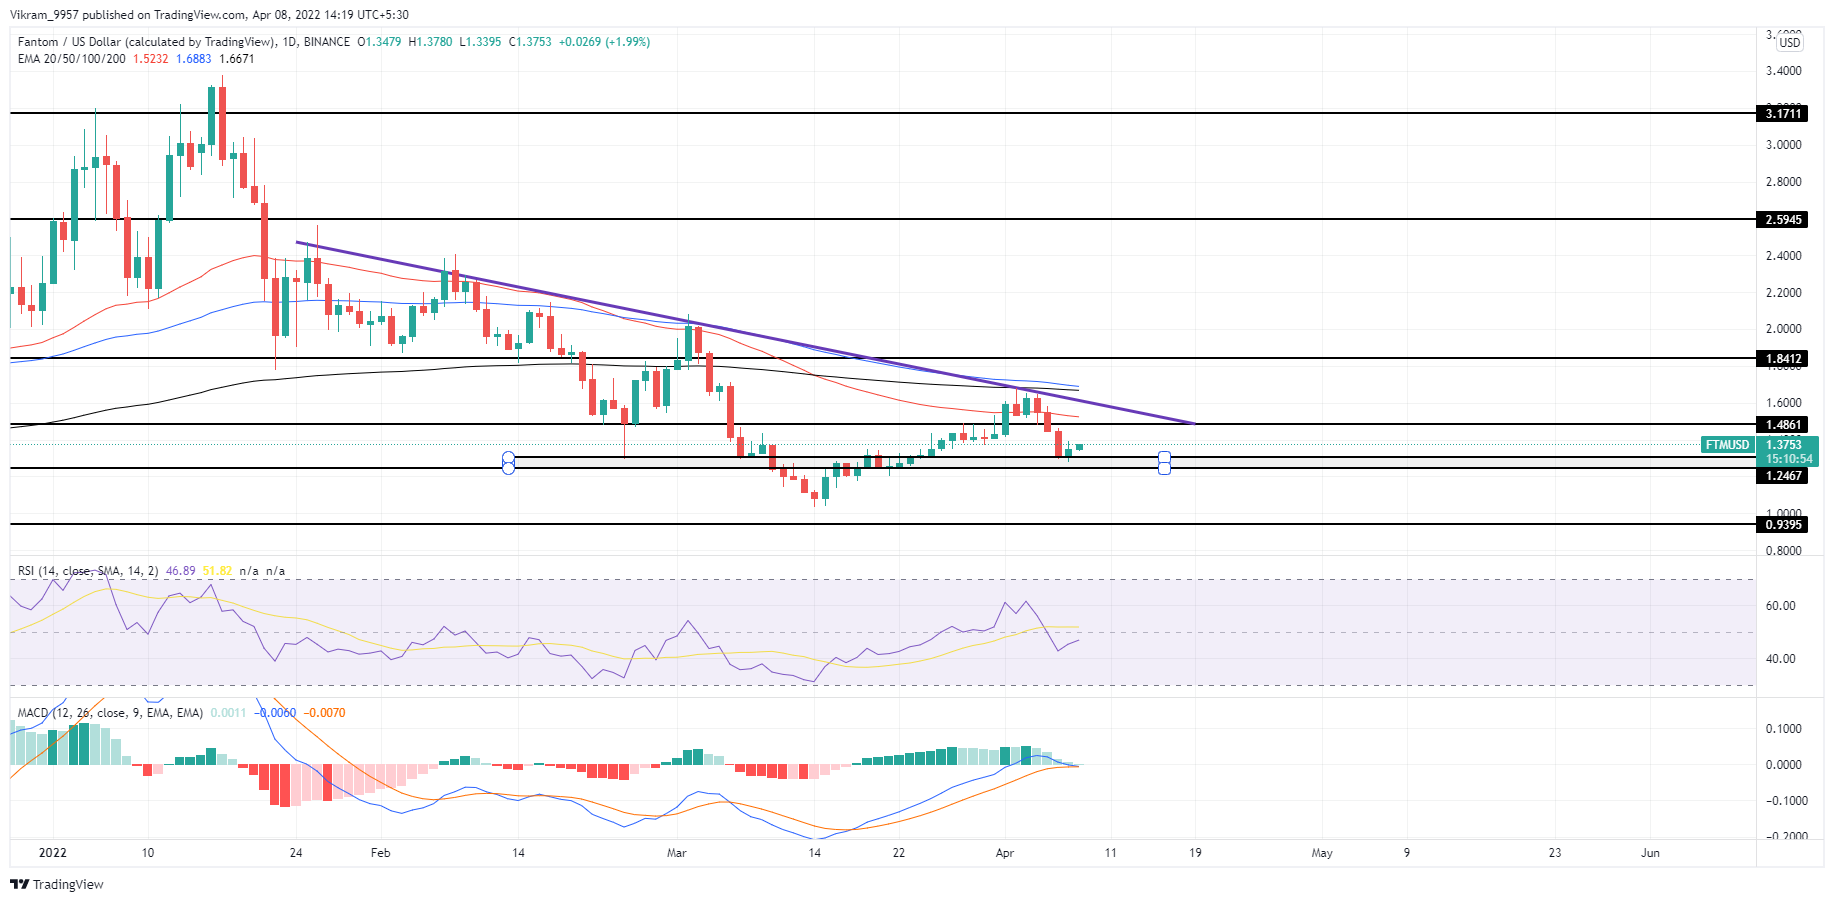
Past Performance of FTM
FTM coin price faces a constant dynamic rejection from the descending resistance trendline in the daily chart. The downtrend under the trendline influence brings the death cross and pushes the prices back to the $1.25 mark. The downtrend accounts for a 48% fall in the past months.
Source-Tradingview
FTM Technical Analysis
FTM coin price forms multiple bearish candles from the $1.65 mark resulting in a fall of 22% earlier this week. However, the bullish candles with minimum range reflect the bottom creation.
The surge in selling pressure influences a downtrend in the daily EMAs, increasing the chances of 100 and 200-day EMA. Moreover, the recent failure to sustain above the 50-day EMA indicates a higher supply present above the EMA.
RSI Indicator: The RSI slope plunges under the confluence of the halfway mark and the 14day average in the recent bearish reversal from the resistance trendline. Hence, the indicator represents the high possibility of a downtrend continuation below $1.25.
MACD Indicator: The MACD and signal lines join at the zero line and give a bearish merger, with may shortly gain a negative spread. Hence, the indicator will show a sell signal with the start of bearish histograms.
In a nutshell, the FTM technical analysis highlights a sellers-driven trendline keeping the bullish growth in check.
Upcoming Trend
FTM coin price shows a reversal to the trendline from the $1.25 mark teasing an upside move of 15%. However, the presence of strong opposition at the 50-day EMA and the resistance trendline diminishes the possibility of an uptrend.
On the opposite end, the downfall of $1.25 will struggle to find support before $1, accounting for a smooth decline of almost 20%.
Support Levels: $1.25 and $1
Resistance Levels: $1.5 and $1.65