


FTM Technical Analysis: In a Bearish Trap, Likely to Continue


Past Performance
On April 19, 2021, FTM started trading at $0.42. As of April 25, 2021, FTM closed at $0.30. Thus, in the past week, the FTM price has declined by roughly 29%. In the last 24 hours, FTM has traded between $0.29 - $0.34.
Day-Ahead and Tomorrow
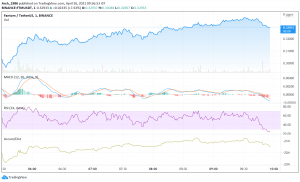
Currently, FTM is trading at $0.33. The price has increased from the day’s opening price of $0.30. Thus, the market seems to be uptick.
The MACD and signal lines are negative. Moreover, a bearish crossover by the MACD line over the signal line has occurred too. Thus, the overall market momentum is bearish and the price is likely to start declining.
The RSI indicator is in the oversold region for the past half an hour. It is currently at 28% and gradually rallying towards the 30% mark. Thus, selling pressures are extremely high. Hence, the price is likely to go down. The RSI indicator is therefore giving further credence to the bearish trend indicated by the MACD oscillator.
For the past half an hour, the A/D indicator is falling. Thus, whale distributions are slowly overtaking the whale accumulations. Hence, like the other two oscillators, the A/D indicator is also pointing to a price decline.
FTM Technical Analysis
As per technical analysis, currently, the price is above the first Fibonacci pivot resistance level of $0.329. It may fall below the Fibonacci pivot point of $0.31 soon. If the bears remain strong till day end, the price is likely to fall below the three support levels of $0.29, $0.28, and $0.26, respectively.
The price has currently broken out of the 23.6% FIB retracement level of $0.328. But, it may soon retest and fall below this level. If by day end, the price falls below the 76.4% FIB retracement level of $0.30, then the price downswing is strong. In that case, the bearish trend is likely to continue tomorrow as well.