


GAS Technical Analysis: Increased Selling Wars $2 Fallout


Table of contents
Key technical points:
Past Performance of GAS
GAS prices fail to rise above the parallel channel as the selling pressure breaks the support trendline to breach the $2.50 mark. The lower price rejection ranging till $2.11 avoids the daily candle closing below the $2.40 mark resulting in a sideways trend. However, the sellers regain trend control with a bearish candle 7.5% fall and warn of a downfall to $2.
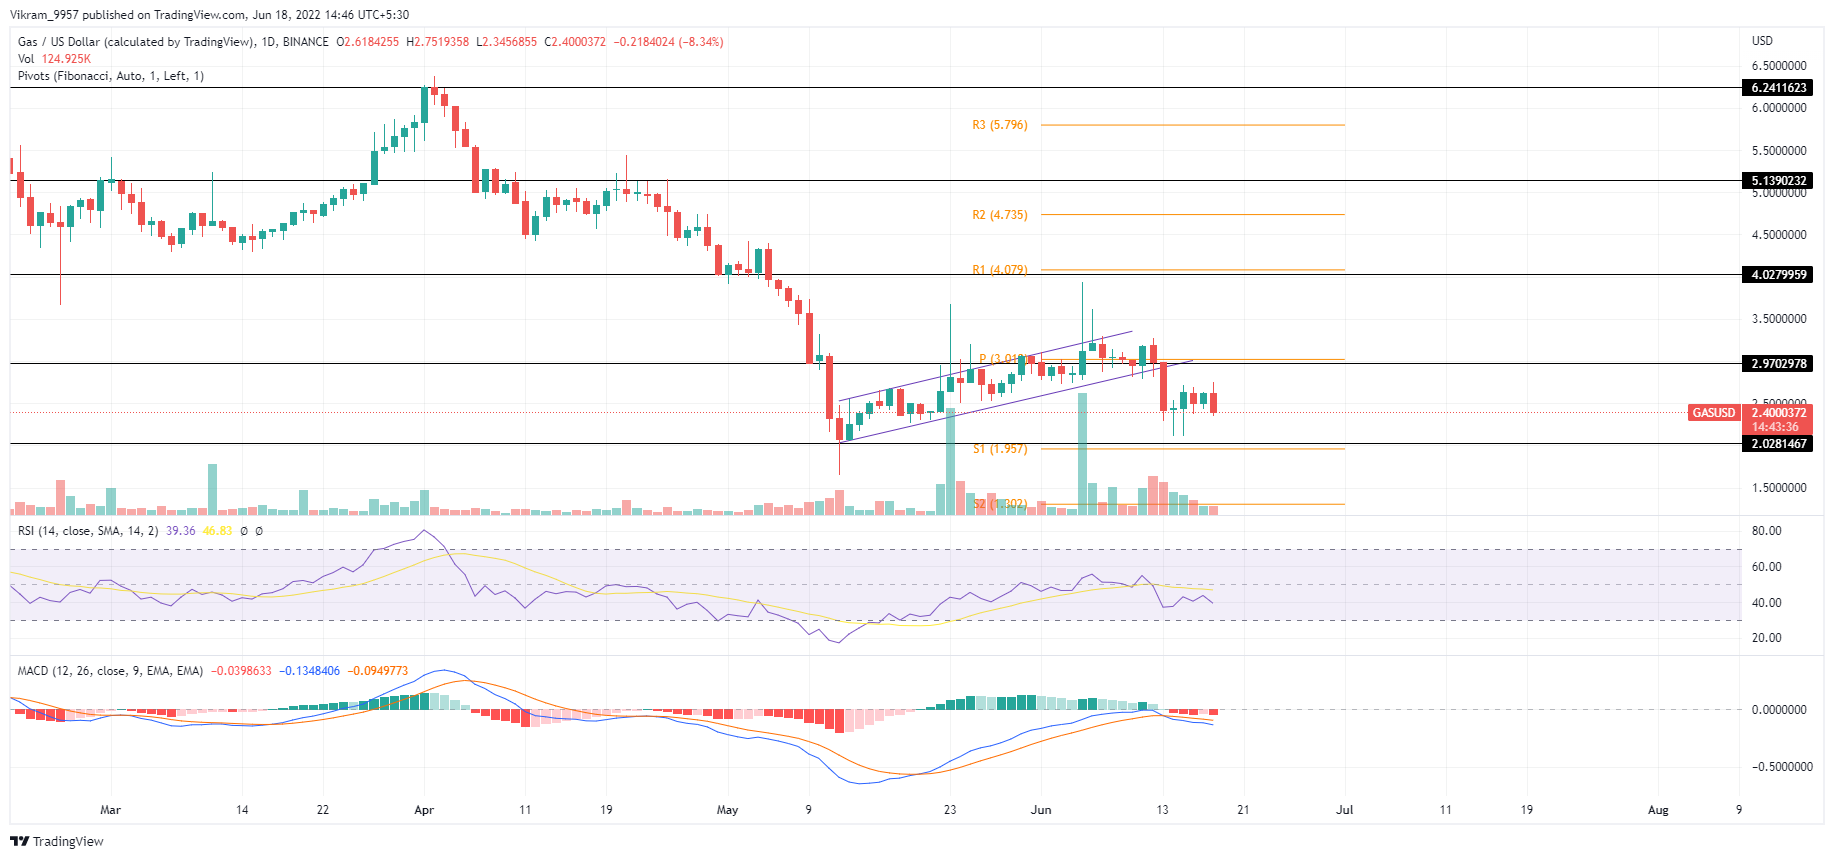
Source- Tradingview
GAS Technical Analysis
GAS prices fall drastically with increased trading volume representing a huge supply dump. Hence, traders looking to ride the fallout rally can consider a closing below $2.40 as an entry spot. The RSI slope shows a sideways trend in the nearly oversold zone slightly below the halfway line under the 14-day SMA influence. However, the diagonal rise in RSI during the sideways price trend represents a bullish divergence teasing a potential price jump.
The MACD indicator shows the fast and slow line maintaining the downtrend as the selling pressure grows. Moreover, the rising trend of the negative MACD histograms represents a high likelihood of downtrend continuation. In a nutshell, the GAS technical analysis forecasts a downtrend continuation if sellers drive the closing price below $2.40.
Upcoming Trend
The pivot points indicate support levels at $2 and $1.30 where the falling GAS prices can take a breather. However, the lower price rejection can drive the prices higher to the $3 pivot level.
Resistance Levels: $2.50 and $3
Support Levels: $2 and $1.30