


HBAR Technical Analysis: Breakout Rally Struggles To Continue


Key technical points:
Past Performance of HBAR
HBAR coin price finds demand near the $0.20 support level resulting in the long-coming resistance trendline breakout with a jump of 10% last week. However, the breakout trend goes into consolidation made up of Doji candlesticks instead of the anticipated rally above the 50-day EMA.
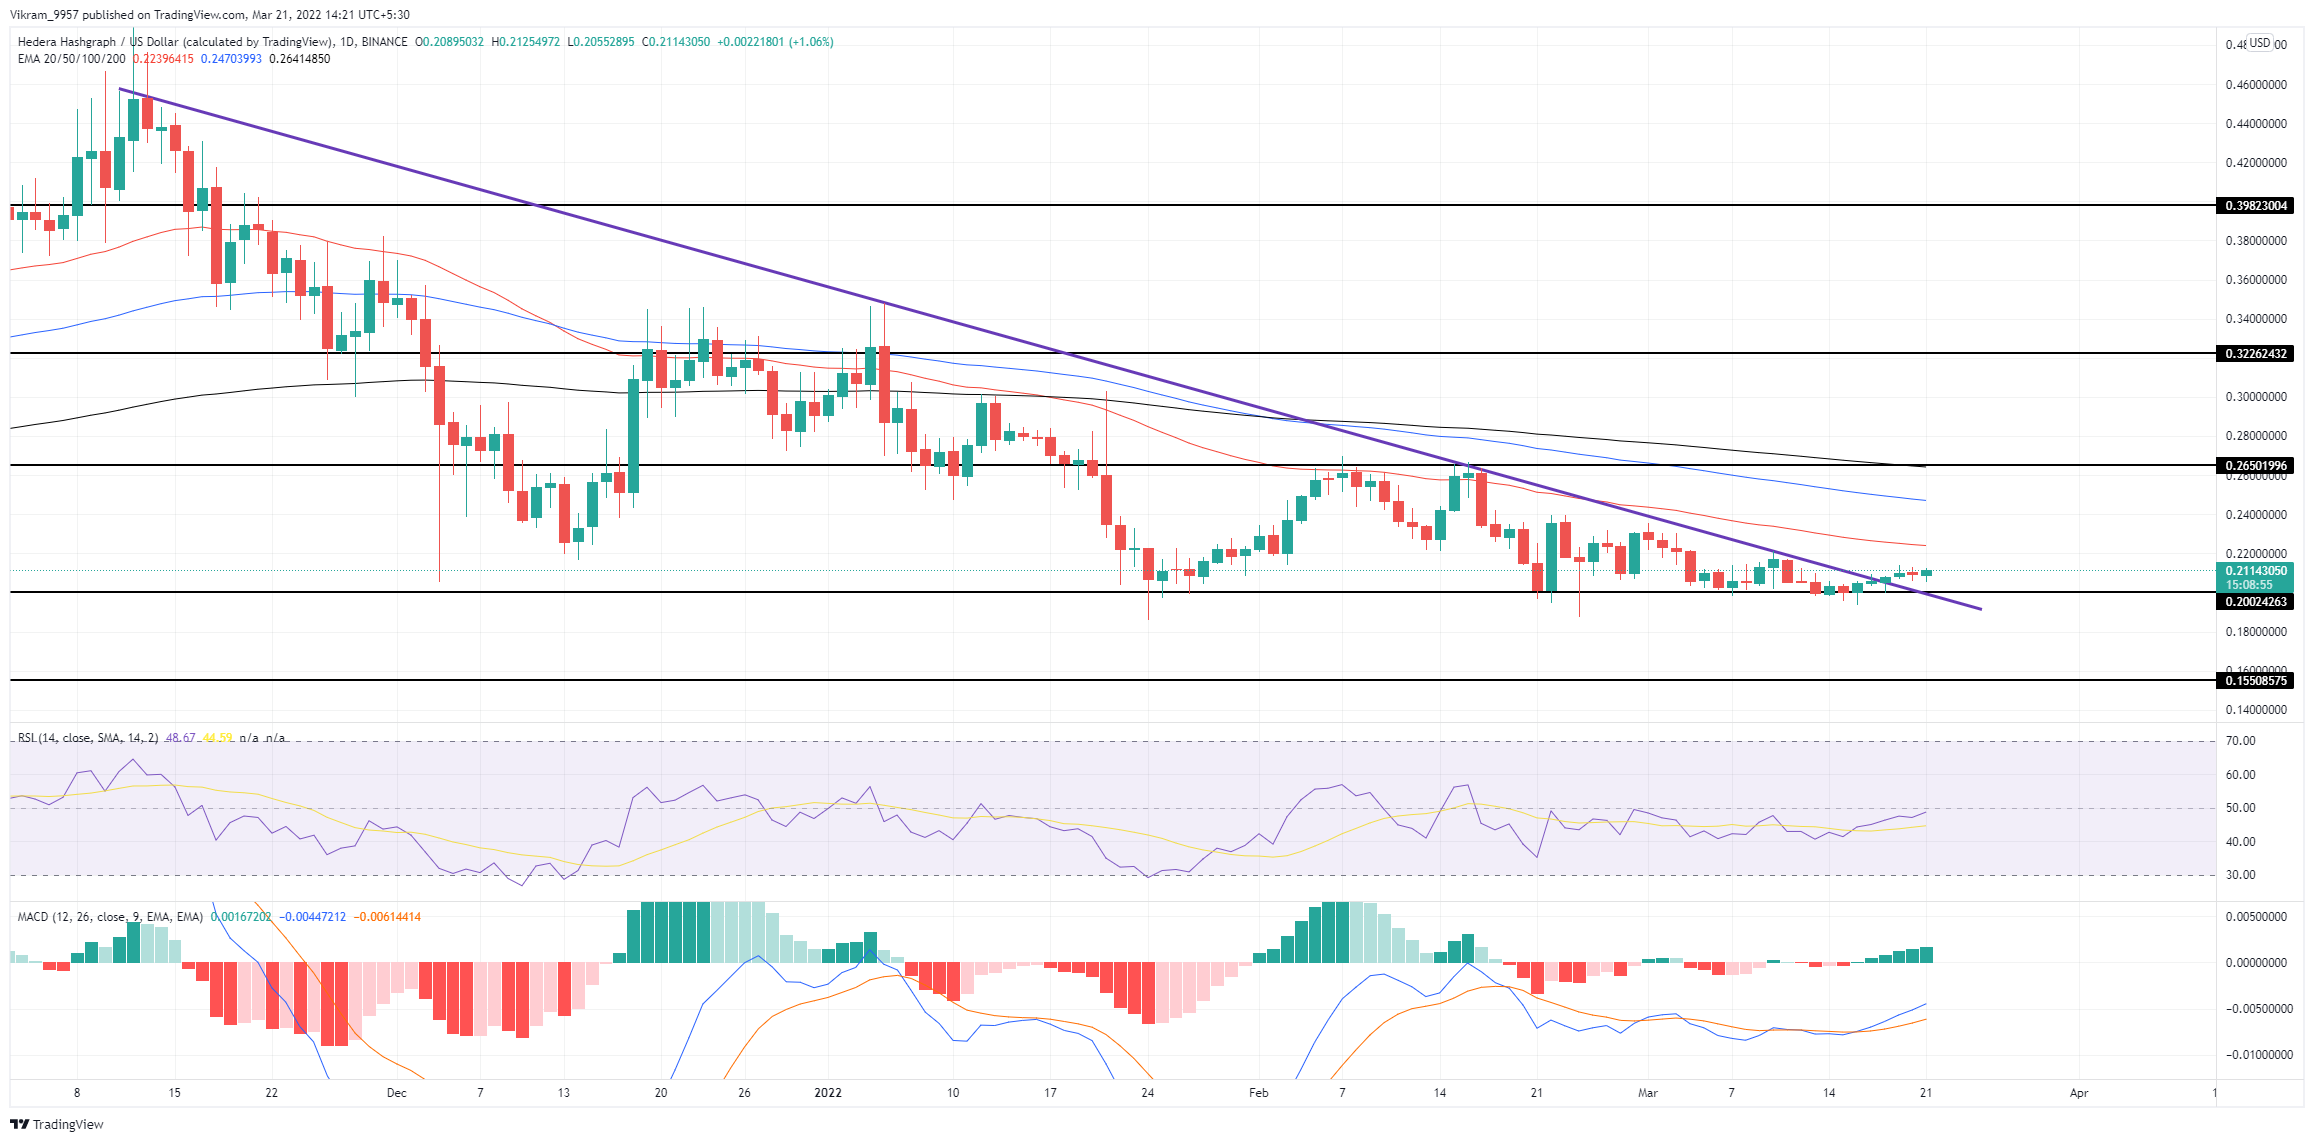
Source-Tradingview
HBAR Technical Analysis
HBAR coin price shows multiple lower price rejection Doji candlesticks post-breakout indicating a solid underlying bullishness. Hence, a jump to the 50-day EMA can be seen in the upcoming sessions.
The crucial EMAs (50, 100, and 200) maintain a bearish formation, with the uptrend enduring numerous turndowns at the 50-day EMA. However, the trendline breakout could result in a price jump to the 50-day EMA.
RSI Indicator: The RSI slope finally surpassed the halfway mark after the constant struggle last month. Furthermore, the 14-day SMA shows a bullish influence as it rises higher.
MACD Indicator: The MACD and signal finally diverge to increase the bullish span and regain the uptrend momentum to reach the zero line. The MACD histograms regain positive momentum indicating a jump in buying pressure.
In a nutshell, the HBAR technical analysis shows a bullish bias despite the post-breakout consolidation.
Upcoming Trend
HBAR coin price could find the bullish rally approaching the $0.25 mark with the 50-day EMA breakout. However, the fallout of the $0.20 support level will nullify the bullish thesis and result in a price fall to the $0.17 mark.
Support Levels: $0.20 and $0.17
Resistance Levels: $0.22 and $0.25