


HBAR Technical Analysis: The First Steps Towards Changing The Trend Have Been Made


Table of contents
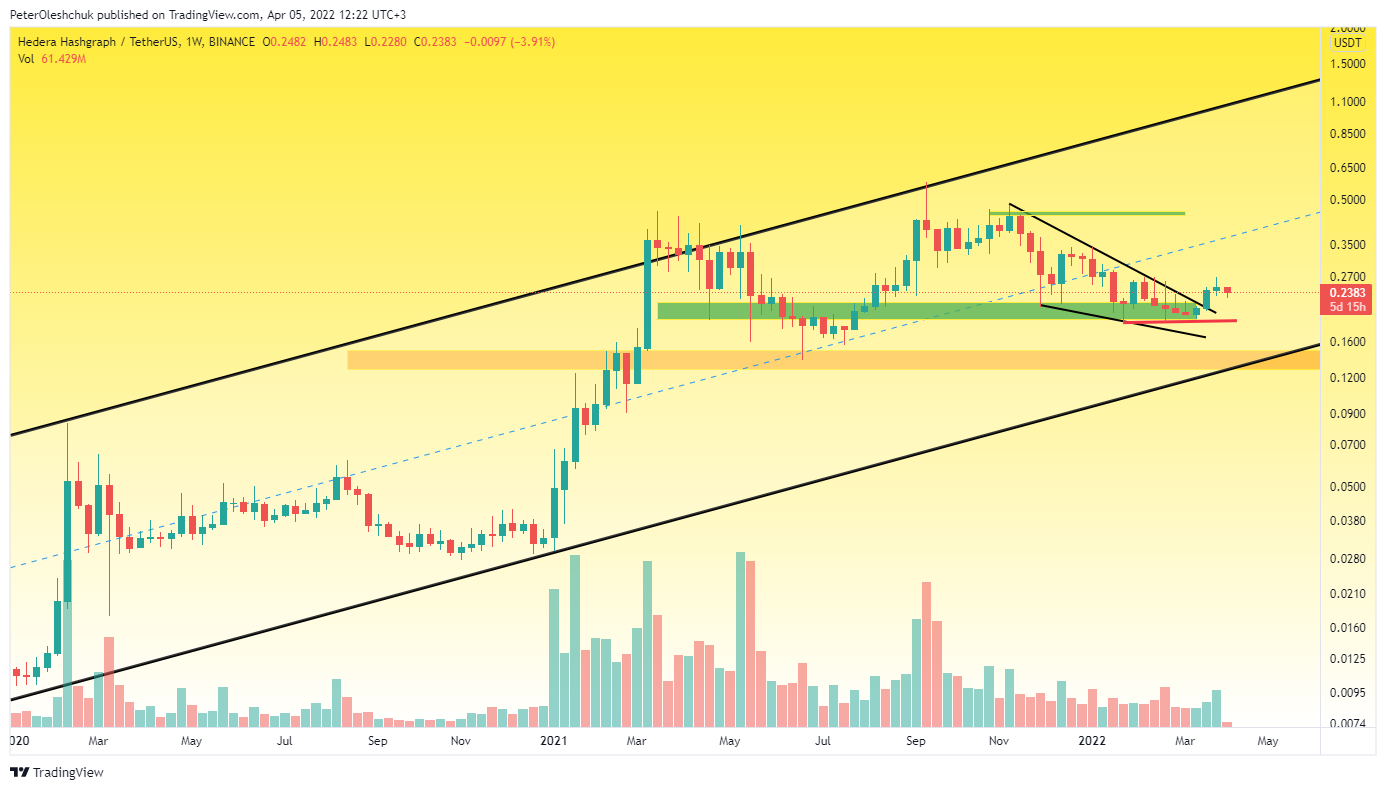
The week of trading on 4 April began with lower prices and testing buyers for strength. In the case of the capitulation of buyers near the mark of $0.268, their main target will be to keep $0.195. In the case of a re-test of this range, investors will have a great chance to buy HBAR at around $0.195 with low risks. An important point the $0.195 test should pass without updating the local low and without aggressive candles on smaller timeframes. In this case, we will expect the formation of a new wave of HBAR growth with the first target of $0.34. The potential final target of this wave of growth is $0.45.
Technical Analysis Of HBAR On The Daily Timeframe

Analyzing the movement of the HBAR price on the daily timeframe, we can see the expansion of the consolidation range. On 29 March the HBAR price tested the upper limit of the newly created consolidation. Buyers have shown the inability to break this limit, even at increased volumes.
At the time of writing, buyers have stopped at the upper limit of consolidation and are preparing for the final attempt to breakthrough. If this attempt fails, we expect HBAR to fall to $0.22. In this range, there is a middle line of consolidation, from where buyers will have every chance to make a new attempt to grow. If support in the range of $0.22 will not be expected to continue the HBAR fall to $0.19. It is not time to consider the negative scenario of the HBAR price movement, namely the fall to $0.15. At least, sellers need to break the $0.19 range down and stay below it. And this will be possible only in the event of a sharp fall in the BTC price.
The HBARBTC price Is Dangerously Drifting Near The Liquidity Level

HBARBTC weekly price timeframe shows that not everything is so great in this kingdom. Starting from the end of February 2022, the HBARBTC price cannot break away from the liquidity range of 0.00000494. In fact, this range has been maintained by HBARBTC since April 2021. Therefore, the loss of control of buyers over this range will mean a total collapse of the market and the beginning of a powerful fall wave to 0.00000350. While buyers do not show much desire to start a new growth wave. The price fall will stop at low volumes and there are no counterattacks. Price volatility is constantly decreasing. If buyers are unable to start growing during April, the situation could end unpleasantly for HBAR investors.