KAVA Technical Analysis: Will KAVA Prices Surpass The $2 Mark?
Table of contents
Key technical points:
Past Performance of KAVA
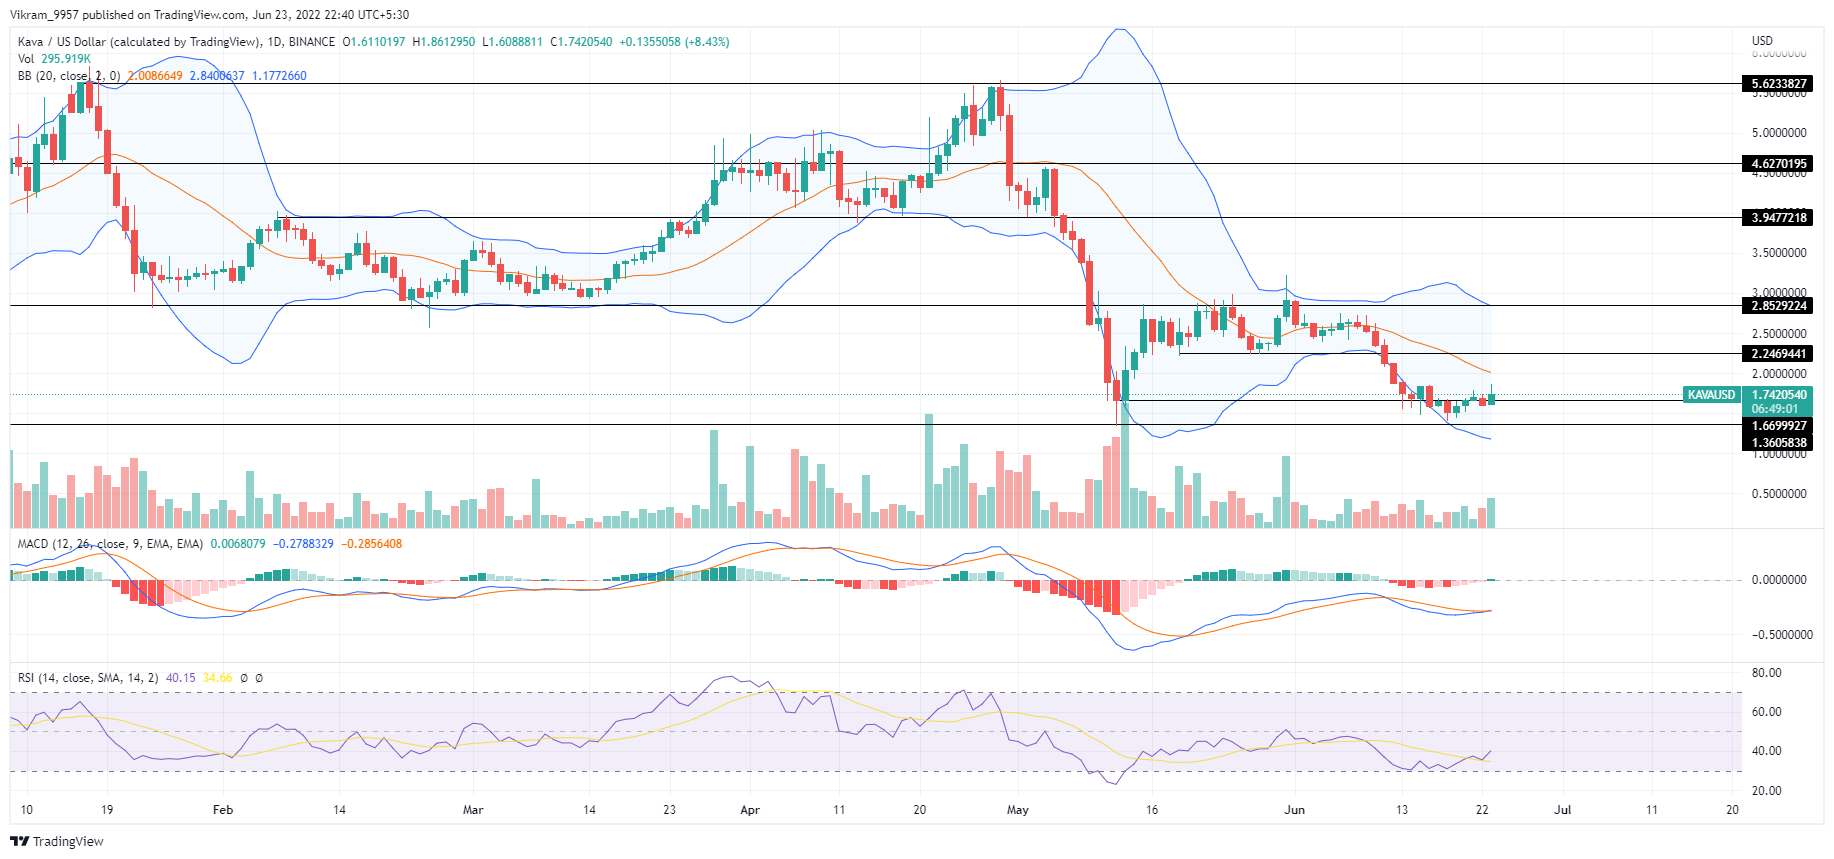
KAVA price action shows a bearish reversal from the $3 after a head and shoulder breakout resulting in a fall under $1.50. The bearish turnaround accounts for a 45% drop in market value leading to a sideways trend above $1.36. However, the improving sentiments drive the prices higher to $1.75, teasing a jump to $2.

Source- Tradingview
KAVA Technical Analysis
KAVA price action shows a higher price rejection candle but the increased trading volume keeps the bullish hope alive. Hence, traders can expect the candle closing above the $1.75 mark as an entry spot.
MACD indicator: The fast and slow lines take a positive turnaround resulting in the bullish crossover and restarting the trend to reach the zero line. Moreover, the bullish MACD histograms resurfacing increase the likelihood of a bullish trend.
RSI indicator: The RSI slope shows growth in underlying bullishness as the sideways trend above the oversold boundary takes a positive spin. Moreover, the reversal rally surpasses the 14-day SMA and continues the uptrend to achieve the halfway line.
In a nutshell, the KAVA technical analysis forecasts a bullish trend as the technical indicators display a surge in buying pressure.
Upcoming Trend
If the daily candle closes above $1.75, KAVA prices will skyrocket above the $2 resistance, and traders can expect the rally to reach $2.25 in the coming days.
Resistance Levels: $1.75 and $2
Support Levels: $1.50 and $1

