


KDA Technical Analysis: KDA Buyers Resurface Upon Retest


Key technical points:
Past Performance of KDA
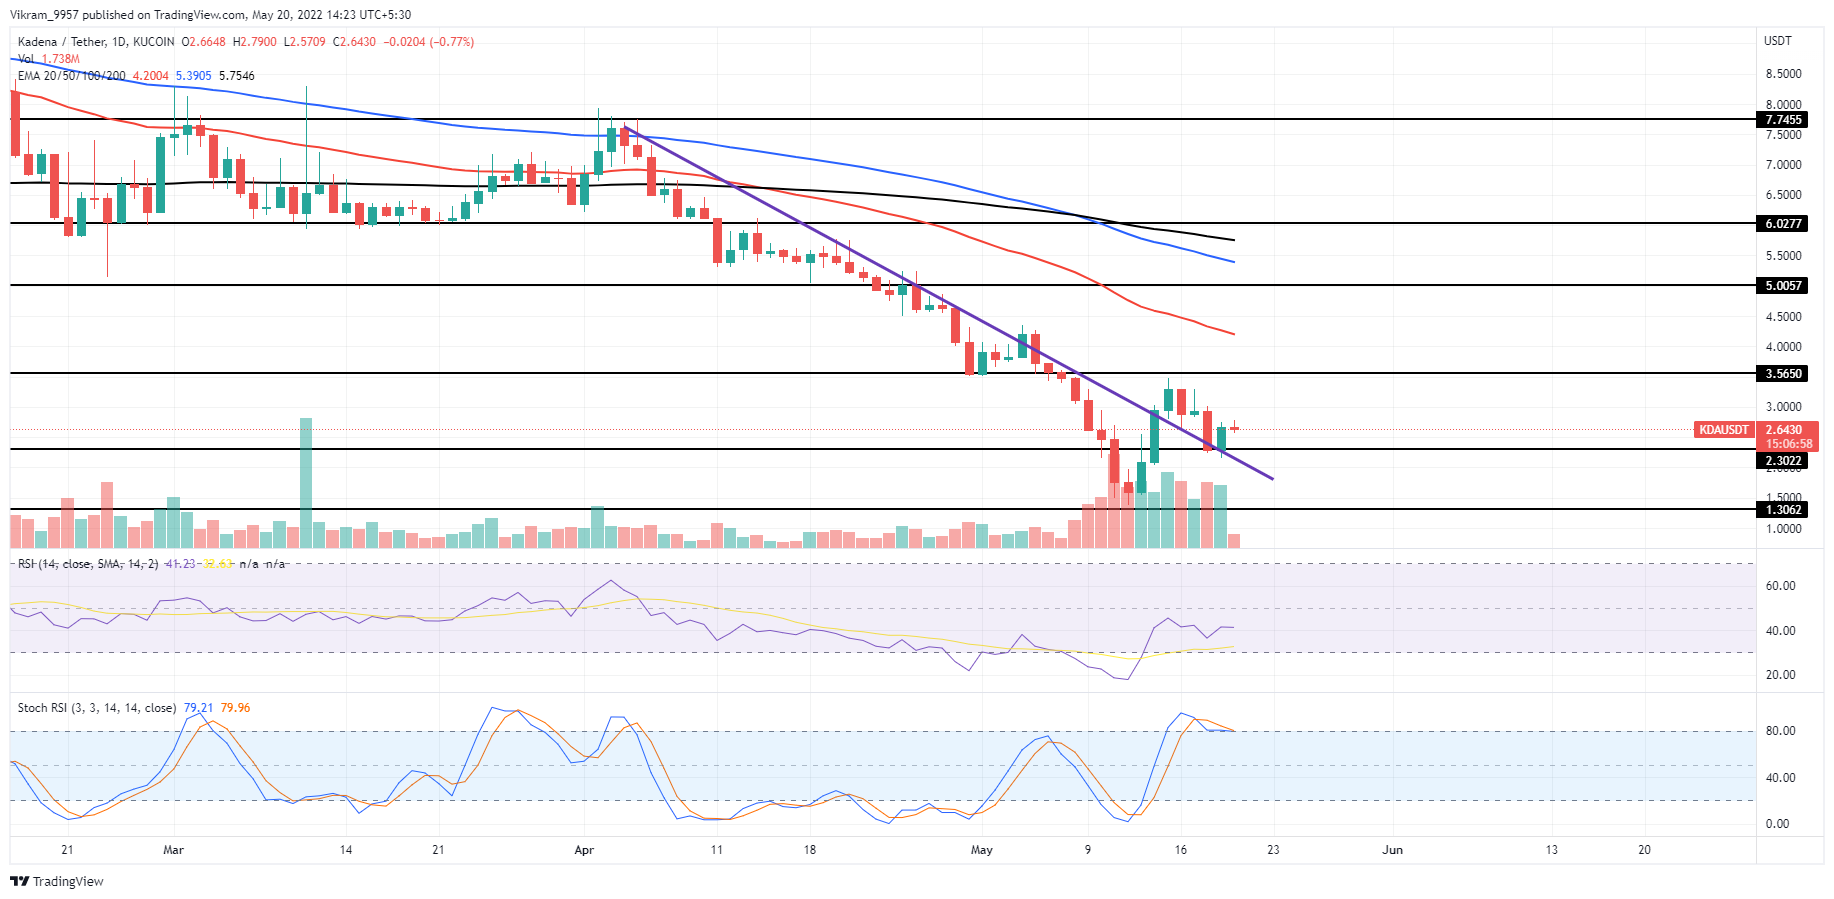
KDA prices broke above the crucial resistance trendline in the daily chart, which kept the downtrend, accounting for an 80% fall, in motion. The bullish reversal from the $1.5 made three consecutive bullish candles reach $3.35, accounting for a 116% surge in market value. However, the bullish failure to sustain the buying pressure led to a takeover by sellers above $3, resulting in a retest of the resistance trendline.
Source-Tradingview
KDA Technical Analysis
KDA price action grows drastically overnight with a 16% bullish candle from the $2.30 support level. This resurgence of buyers indicates the start of a post-retest reversal. Hence, the chances of a prolonged uptrend increase significantly.
The crucial EMAs maintain a bearish trend after the recent negative crossover of the 100 and 200-day EMAs. However, the trendline retest might lead to a bullish rally to the 50-day EMA.
The RSI slope struggles to reach the halfway line as it moves sideways trend in the nearly oversold zone. However, despite a sideways trend, the reversal from the oversold zone breaks the bearish influence of the 14-day SMA.
The Stochastic RSI shows the K and D lines ready to regain the bullish alignment to undermine the previous bearish crossover. Moreover, the lines sustaining in the overbought zone reflect a solid bullish trend.
In short, the KDA technical analysis projects a post-reversal rally ready to pick up the pace and reach the $3.5mark.
Upcoming Trend
If KDA prices sustain the bullish momentum, an upside rally to $3.5 seems inevitable, which will increase the breakout chances to reach 50-day EMA at $4.25.
Support Levels: $2.30 and $1.30
Resistance Levels: $3.50 and $4.25