


LINK Technical Analysis: Upcoming Reversal Soon To Break $10


Table of contents
Key Technical Points:
Past Performance of LINK
As we mentioned in our previous analysis, the Chainlink (LINK) price broke the 100-day SMA after retesting the consolidation breakout to reach $9.50. However, the increased selling pressure at $9.50 nullified the rounding bottom breakout possibility leading to an 8% drop over the last 72 hours. Additionally, the resulting downtrend creates a three-black crows pattern but the recent Doji candle hints at a morning star pattern formation.
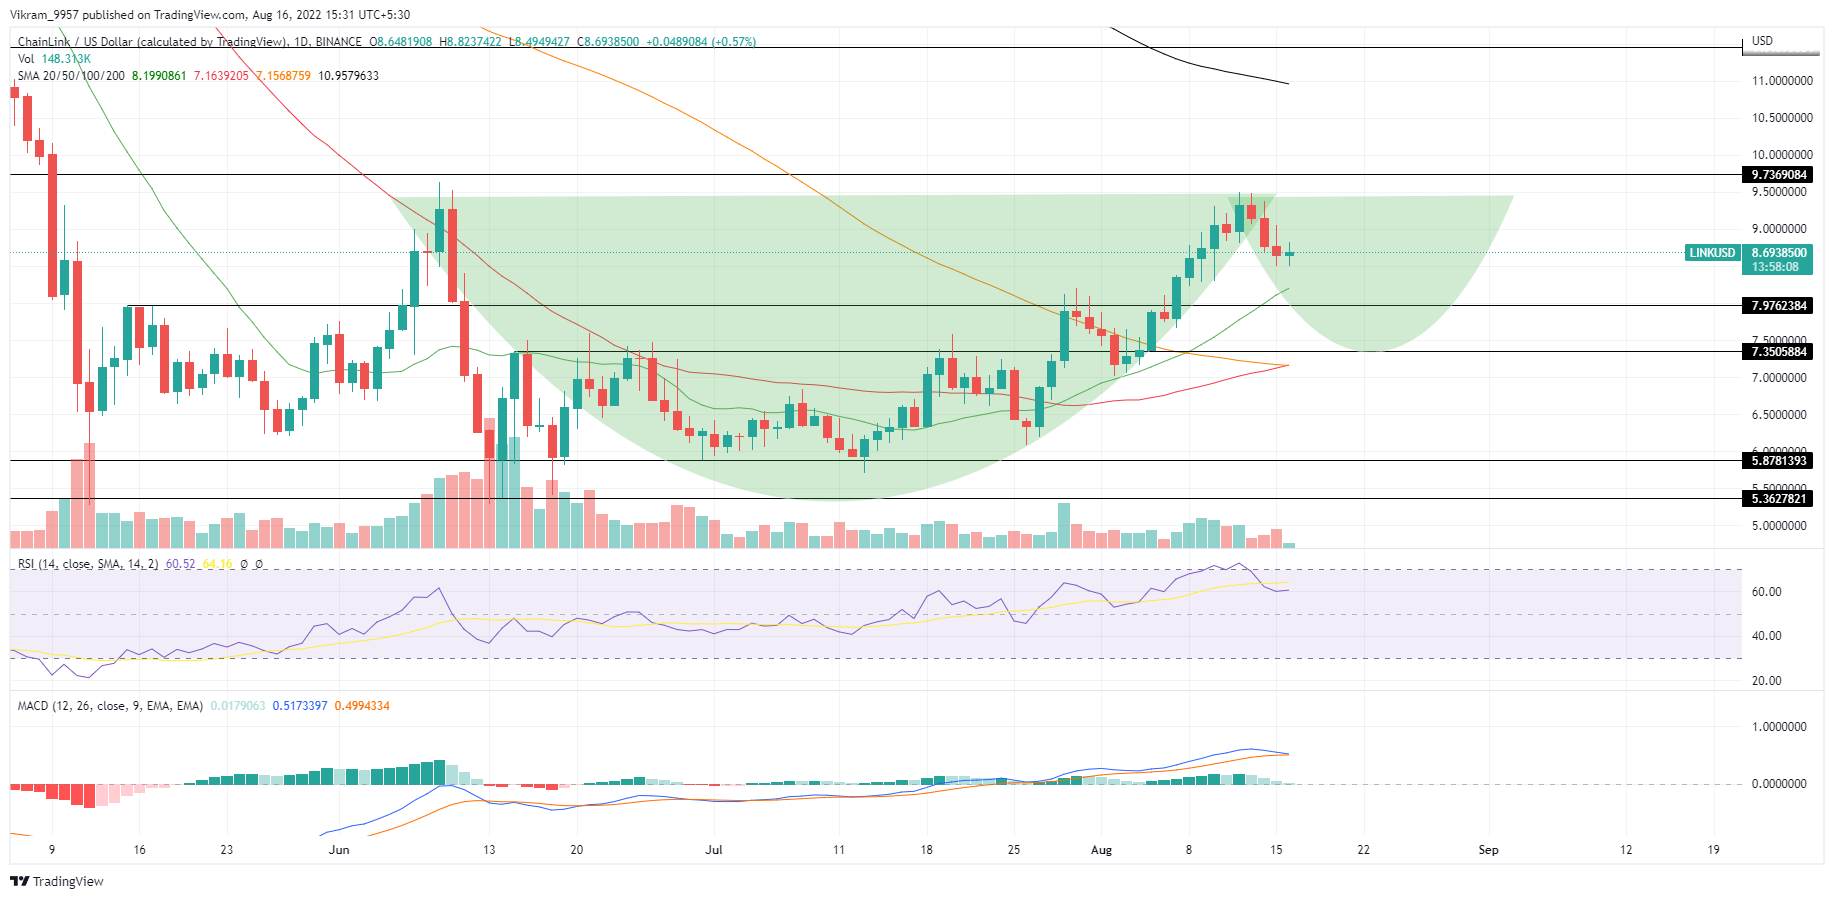
Source - Tradingview
LINK Technical Analysis
The falling LINK price action teases the handle formation that may shortly take reversal from $8. This minor pullback may discount the coin price and attract more buyers to the market. The 20-and-100-day SMA nearing a bullish crossover at $8.4 could stall the current correction.
Despite the current correction, the daily RSI line remains above the midline, indicating the bullish sentiment is intact. However, the MACD indicator on the verge of bearish crossover may assist selling in extending the downfall below the 20 SMA.
In a nutshell, the LINK technical analysis foretells a minor correction phase before the price resume the prevailing trend.
Upcoming Trend
The expected retracement may plunge the LINK price to $8 or $7.17 to form the base support of the handle portion. If the bullish momentum replenishes at this support, the buyers may drive the market price back to the neckline resistance of $9.5.
Under the pattern's influence, the coin price should breach the neckline ($9.5) and extend the ongoing recovery 14% higher to $10.8, followed by $12.3
Resistance Levels: $10.8 and $12.3
Support Levels: $8 and $7.17