LRC Technical Analysis: Bearish Pattern Drives Prices Below $0.70
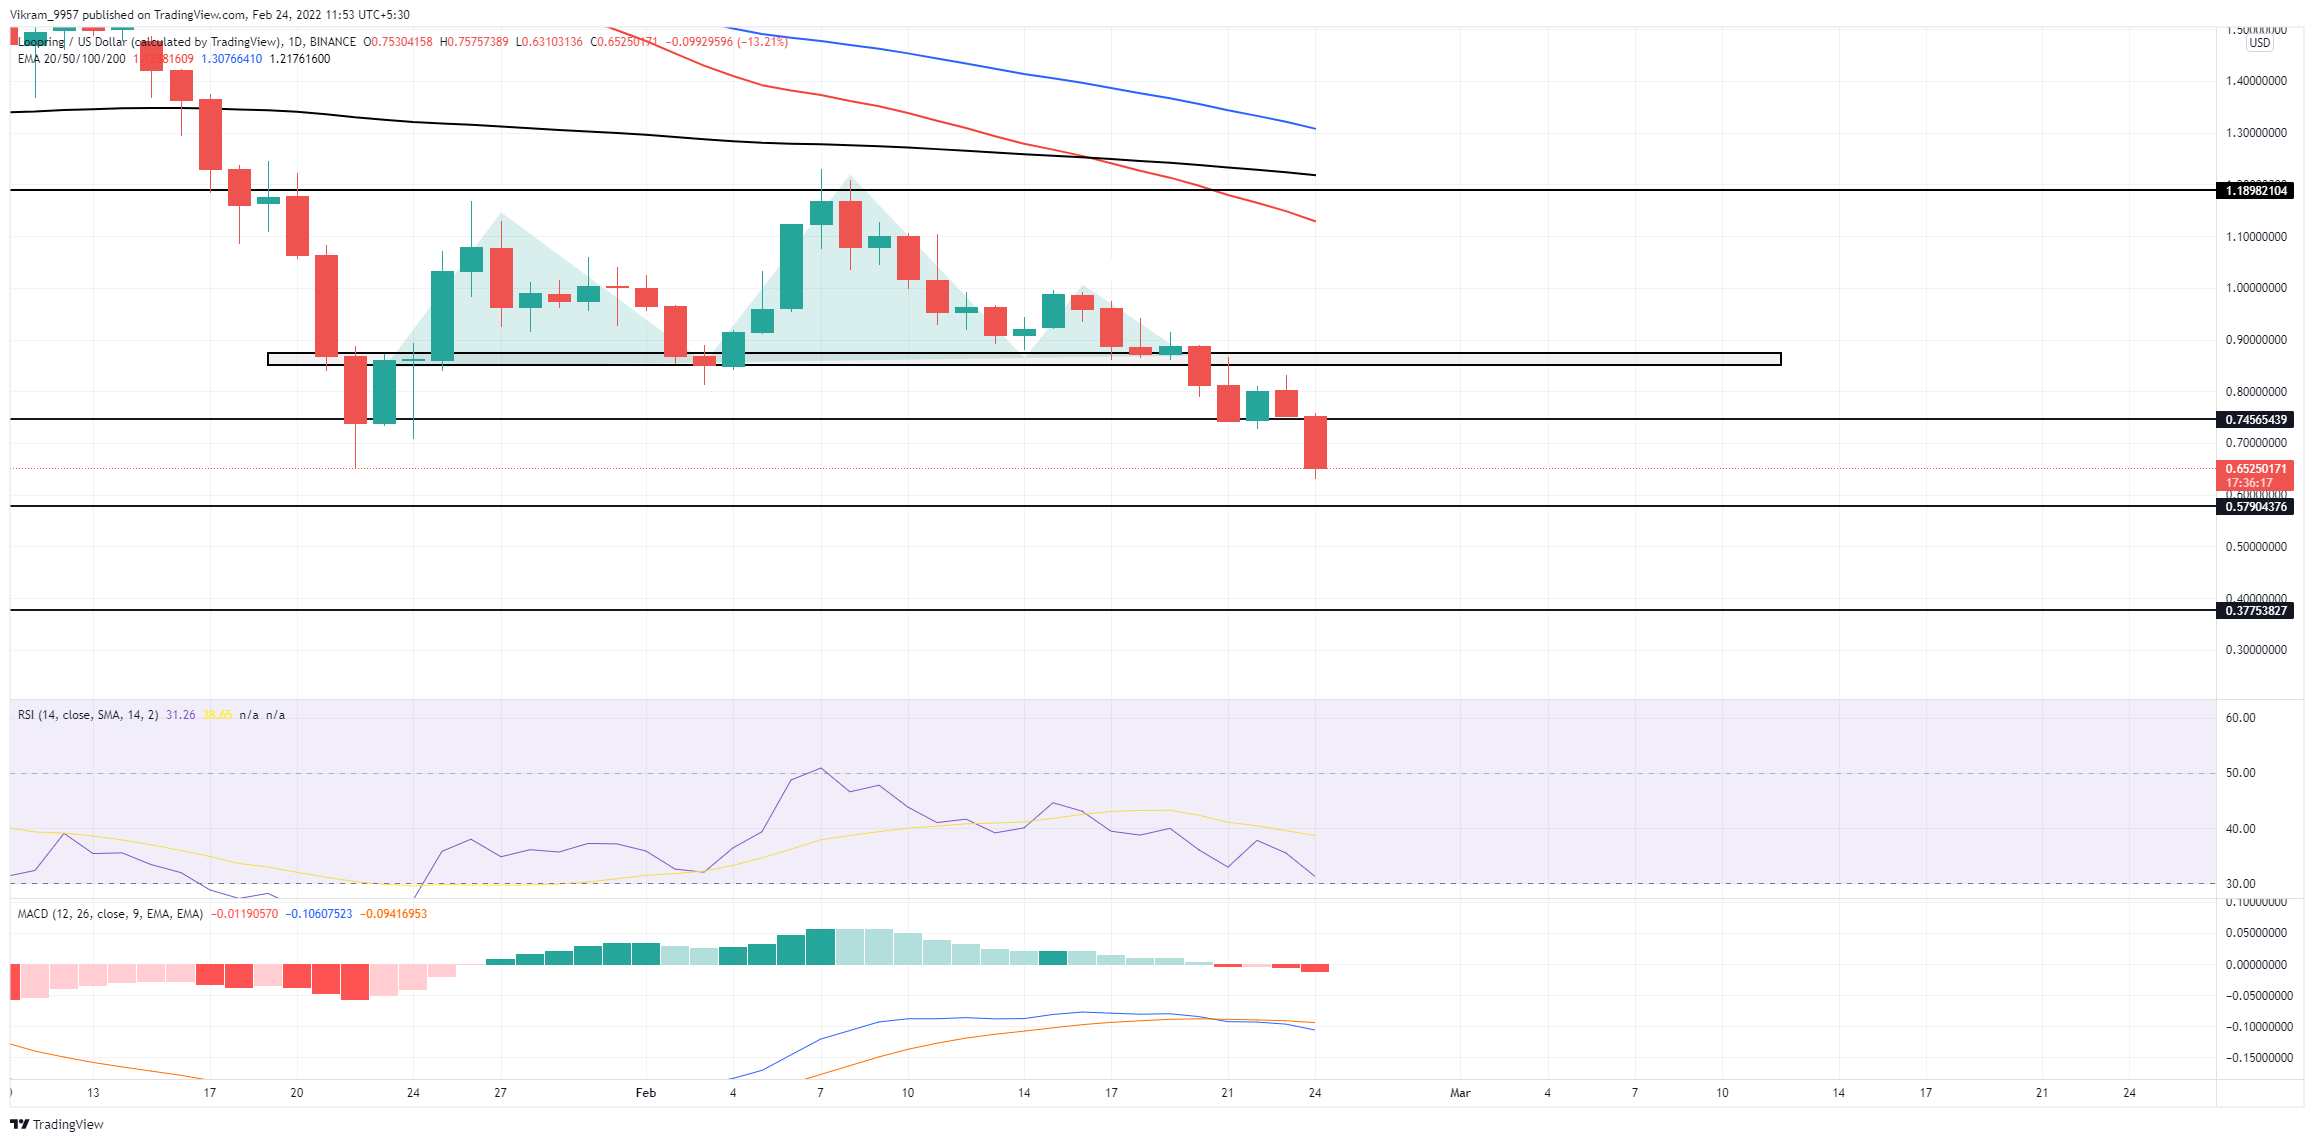
Under the influence of a death crossover, the LRC coin price falls below the $0.85 zone resulting in the head and shoulder fallout. The neckline breakout dives below the $0.74 support level and hits the $0.65 mark. Will the downtrend continuation reach $0.50?
Key technical points:
Past Performance of LRC
The reversal from the $0.75 showcased the LRC coin price resonating between the $0.85 and $1.20. The resonance led to the head and shoulder pattern formation with the neckline at $0.85. On 20th February, the sudden surge in the bearish wave resulted in the breakdown of $0.85 and resulted in a $0.75 retest. Today, the post-retest downtrend continues to reach the $0.65 mark.

Source-Tradingview
LRC Technical Analysis
The $0.85 retest drove the LRC coin price lower and continues to fall with increasing selling pressure evident by rising in trading volume. That is why the bearish engulfing candle gives an impression of prices closing below the $0.60 mark.
The crucial 50, and 200-day EMAs showcase a post-death cross-falling trend that imprints bearish influence on the trend. Moreover, the negative slope of the 100-day EMA indicates the possibility of a crossover with the 200-day EMA.
The RSI Indicator slope fails to sustain above the 14-day SMA and reaches the oversold zone. However, the slope reflects a bullish divergence between the previous dip at $0.75 and the current downfall.
The MACD indicator shows a bearish crossover of the MACD and signal lines as they fail to enter the positive territory. Moreover, the crossover initiates the start of bearish histograms indicating a rise in selling pressure.

Source - InToTheBlock
The onchain data, by intotheblock, shows the GIOM indicator reflecting the support cluster between $0.40 to $0.57 significantly stronger than the resistance between $0.73 and $0.85. Hence, a reversal is possible near the $0.57 mark.
In short, the LRC technical analysis pushes the idea of a downfall below the $0.60 mark.
Upcoming Trend
The LRC coin price marks the start of a new lower low formation with a breakout of $0.85. The price action hints of a new bottom creation at the $0.55 mark. Hence, investors can anticipate a bearish upcoming trend.
Support Levels: $0.60 and $0.55
Resistance Levels: $0.75 and $0.85

