


NEAR Technical Analysis: $3.5 Support Level Cushions Triangle Fallout


Table of contents
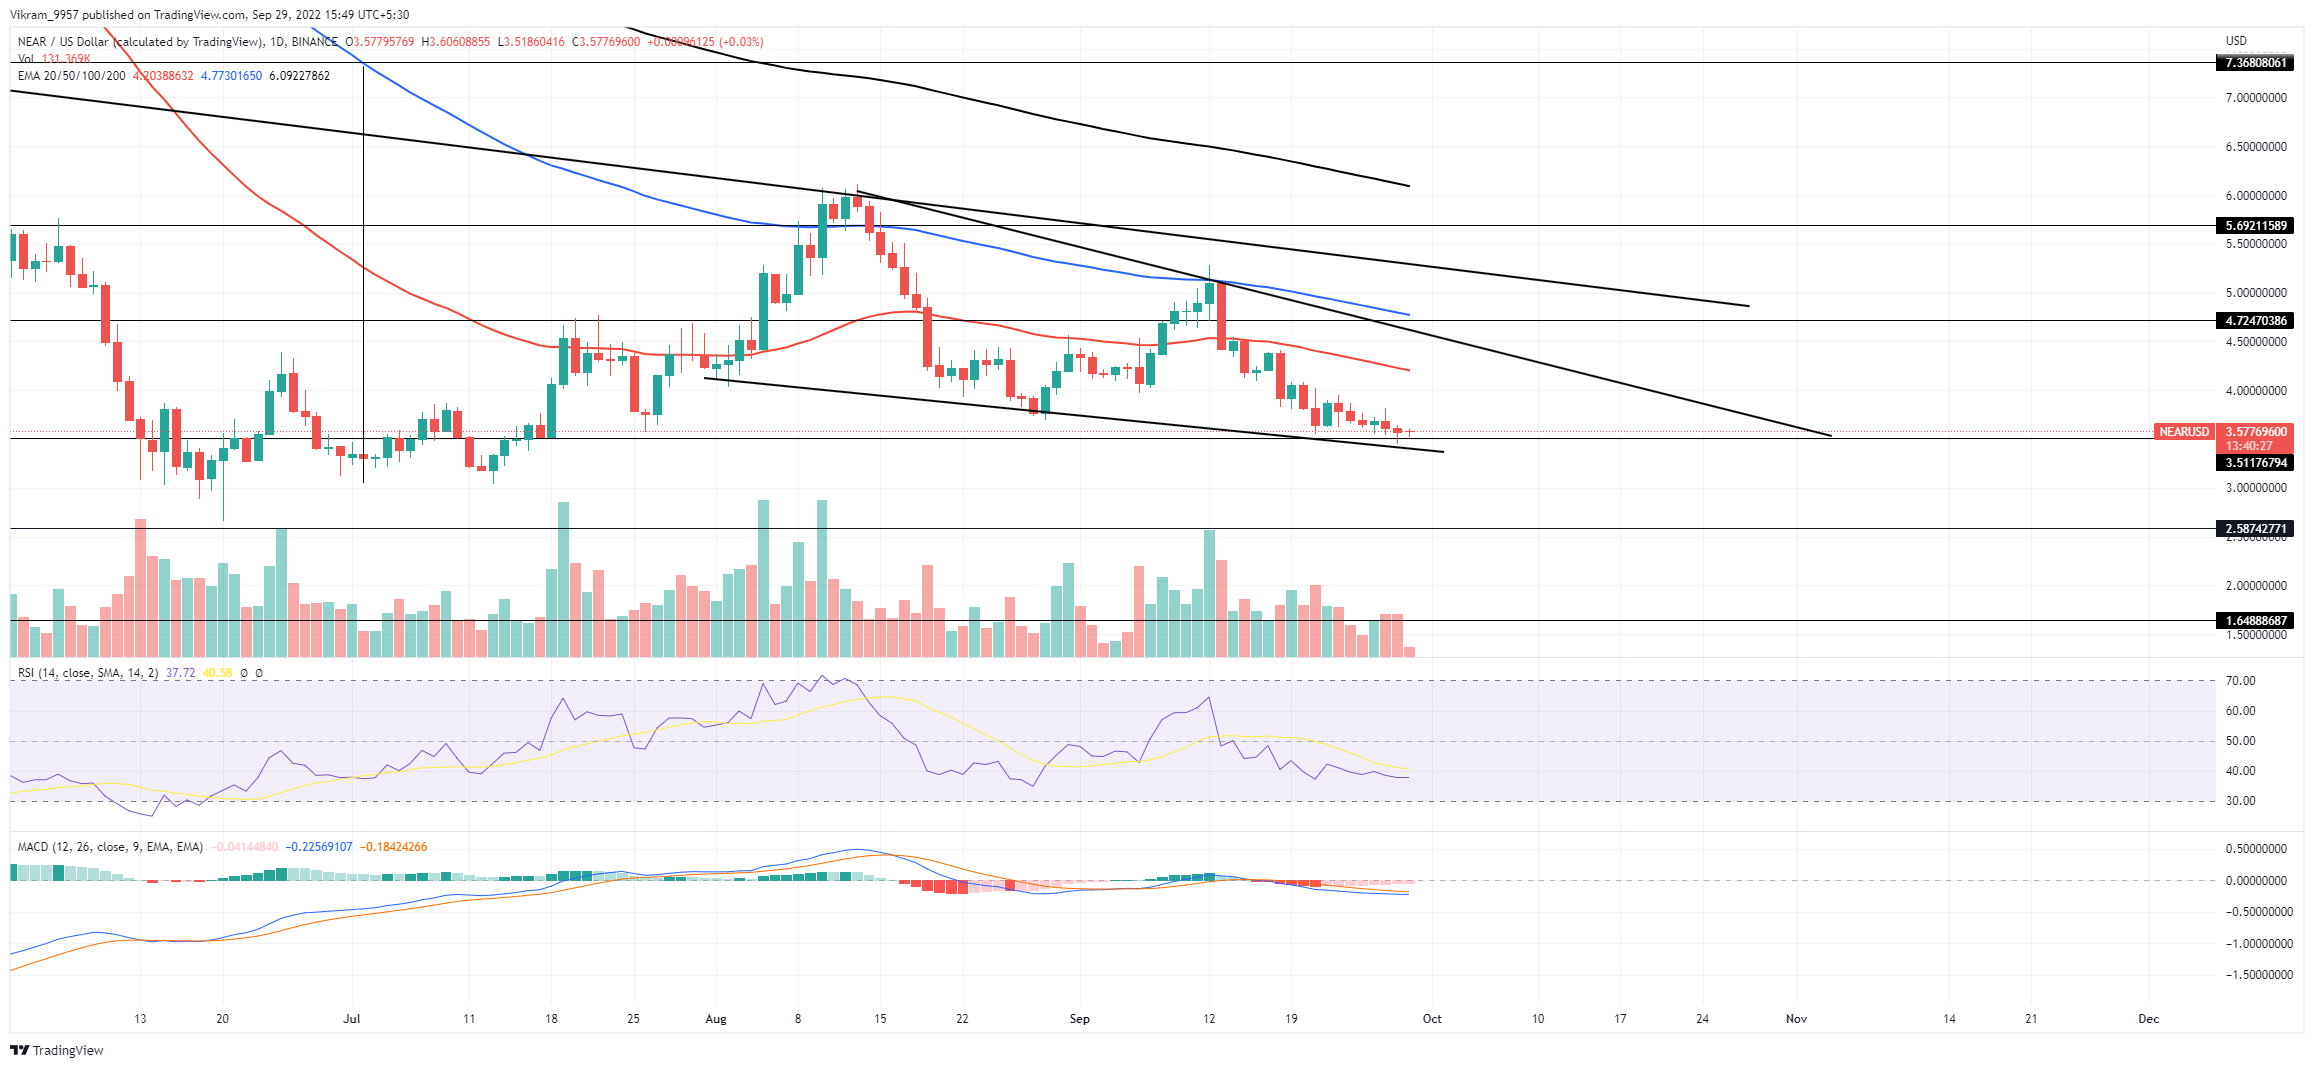
The NEAR price action displays a triangle fallout rally, struggling to crawl under the bottom support level at $3.5. Additionally, the lower price rejection candles at the support level tease a trend reversal rally to retest the triangle breakout. So, should you consider taking a short-term bullish entry?
Key Points:

Source - TradingView
NEAR Technical Analysis
The NEAR price action displays the recent rejection from the 100-day EMA in a triangle pattern to test the bottom support level of $3.5. The correction phase accounts for a depreciation of 30% within a fortnight and increases bearish momentum in the declining EMAs.
Furthermore, the declining price trend generates a new resistance trendline leading to a falling wedge pattern. Currently, the market price rests at the support confluence of the descending trendline and the $3.5 support level.
Source - TradingView
However, the increasing trend in the intraday trading volume supporting the Doji candles at the $3.5 mark projects a high possibility of a trend reversal. Therefore, if the buying pressure increases, we can expect the bullish rally to continue to the overhead resistance trendline at $4.5.
Conversely, if the sellers gain momentum below $3.5, the NEAR market price will tumble to the bottom support at $2.58.
Technical Indicators
The RSI slope spikes display a declining trend in the nearly oversold zone under the 14-day SMA's influence reflecting weakness in the bullish prowess. Moreover, the MACD indicator shows the declining bearish spread between the fast and slow lines teasing a bullish crossover.
Therefore, the technical indicators show the underlying sentiments are taking the bullish highway. As a result, the NEAR technical analysis forecasts a bullish breakout of the $1.20 breakout.
Resistance Levels - $4 and $4.5
Support Levels - $3.5 and $2.58