


NEO Technical Analysis: New Week Brings New Hope For NEO Buyers


Key technical points:
Past Performance of NEO
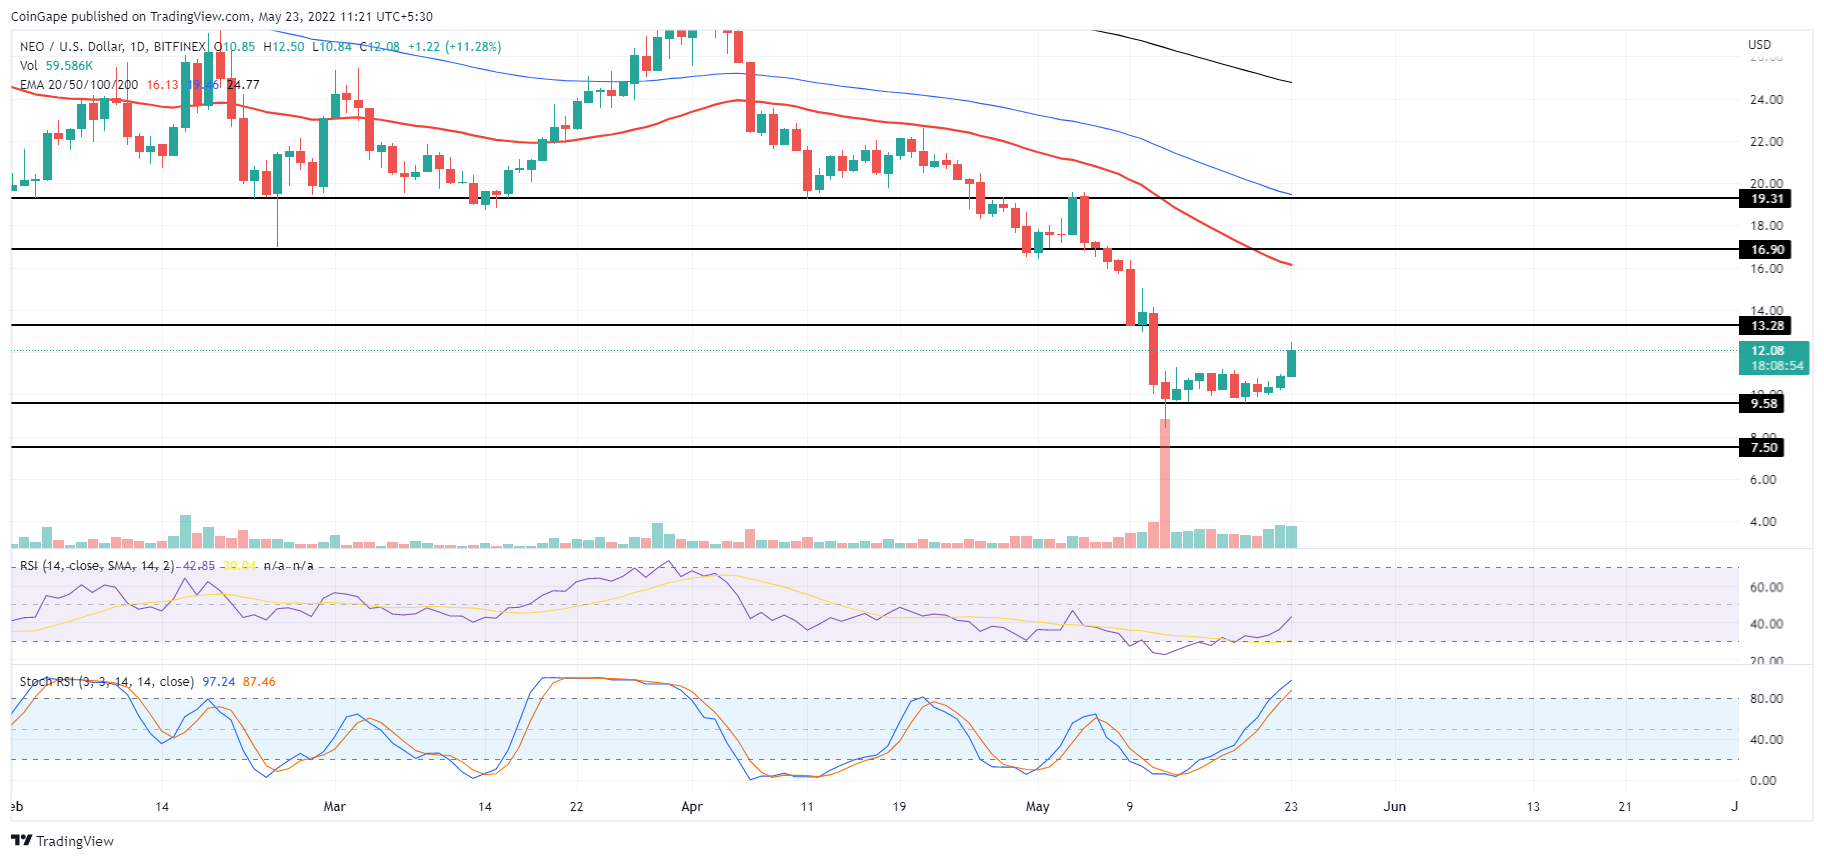
In analyzing the performance this month of NEO, the month began with a drastic fall resulting in cutting the market value of $19 in half to $9.5, followed by a consolidation range. The underlying increase in the consolidation range was evident, with the double bottom formation at $9.5. Eventually, the upside reversal started with consecutive bullish candles resulting in the range breakout with a 16% jump.
Source-Tradingview
NEO Technical Analysis
Support the price jump, NEO trading volume skyrockets 170% reflecting a surge in the number of buyers. Hence, the chances of a prolonged uptrend increase with the growing confidence of buyers.
The falling daily EMAs daily are in the bearish trend, with the spread growing between the 50 and 100-day EAs, showing a steady downward trend.
The RSI rises above the boundary of the oversold zone by a parabolic turn to reach over an average of 14 days, denoted by the yellow line. In addition, the Stochastic indicator displays the K and D lines that continue to move upwards and highlight the underlying bull cycle.
Therefore, the indicators show the increase in demand and suggest the possibility of an ongoing upward trend.
Upcoming Trend
As NEO prices rise in tandem with the increase in trading volume, the chance of a $13.28 test increases. If it exceeds the resistance mark, the trend will be watching $16 as it tries to test that 50-day EMA.
Support Levels: $9.5 and $7.5
Resistance Levels: $13.28 and $16