


QTUM Technical Analysis: Is This The Best Time To Buy Quantum?


Table of contents
Key Technical Points:
Past Performance of QTUM
As mentioned in our previous analysis, the QTUM prices were under a consolidation range ranging from $2.58 to $3.16. However, the recent bull cycle starting on 13 July accounts for a price jump of more than 20% and breaks overhead resistance along with the 50day SMA. However, the prices are yet to close above the consolidation range to signal a bullish breakout.
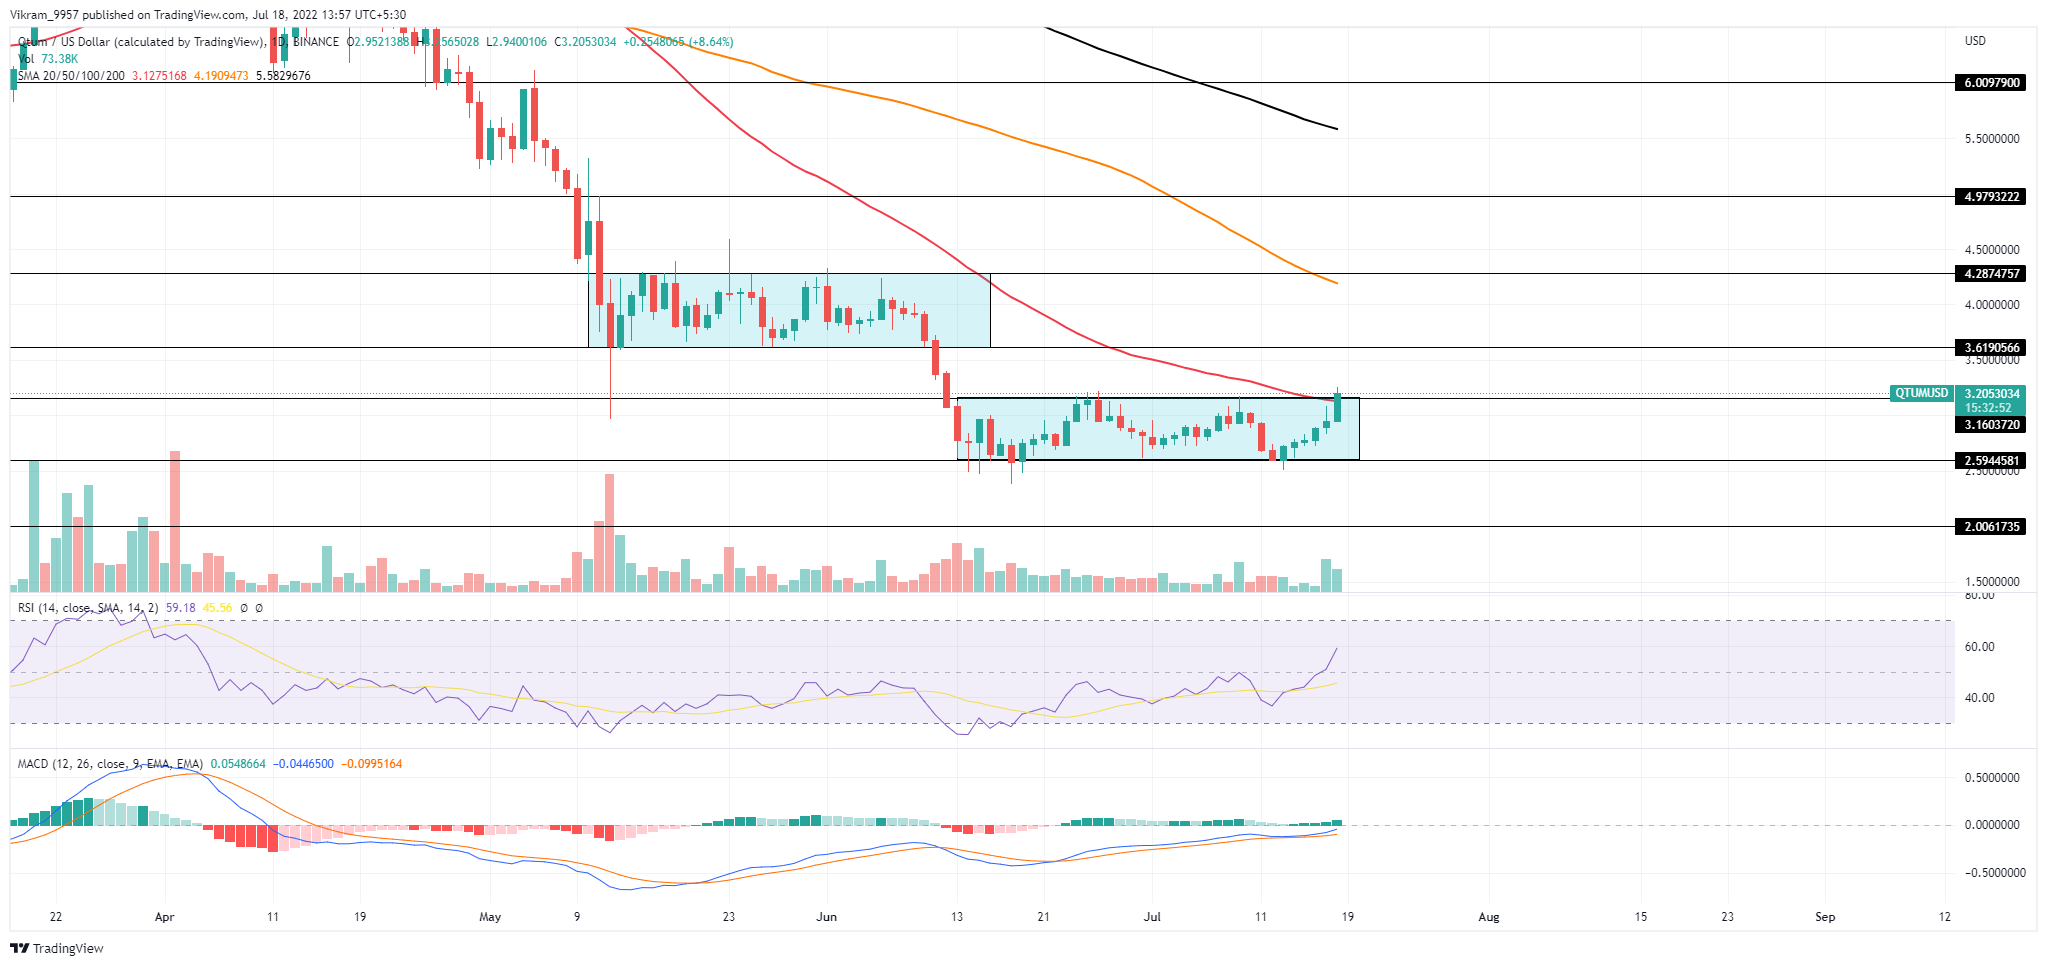
Source - Tradingview
QTUM Technical Analysis
The QTUM price chart displays growth in buying pressure evident from the spike in intraday trading volume supporting the breakout candle. And traders hoping to ride the breakout rally can find a buying opportunity if the closing price exceeds the 50-day SMA.
As the prices exceed the 50-day SMA, the possibility of a bull run to the overhead resistance of the 100-day SMA increases. Hence Traders can hold the breakout rally to jump 30% and exceed the $4 resistance level.
The RSI indicator shows a sharp reversal from the nearly oversold zone, ready to reach the overboard boundary. Hence the indicator shows an increase in the underlying bullishness, increasing the likelihood of a high momentum breakout rally.
The MACD indicator shows the fast and slow lines reemerging in a bullish alignment to approach the zero line with an increase in the positive histograms. Hence the momentum indicator shows an increase in buying pressure which supports the breakout theory.
In a nutshell, QTUM technical analysis projects a high likelihood of a bullish trend continuation to the next opposing SMA.
Upcoming Trend
If the QTUM prices sustain about the 50-day SMA, traders can expect the bullish breakout rally to reach the $4 mark.
Resistance Levels: $3.5 and $4
Support Levels: $3.16 and $3