Rarible (RARI) and the Graph (GRT) Technical Analysis: Are Bears Losing Momentum?
Table of contents
Rarible (RARI)
The community-driven NFT marketplace depends on RARI for governance.
Past Performance of RARI
The Rarible token remains suppressed, reading from the RARI technical analysis of the daily chart. Notably, gains posted in early October, reversing RARI crypto losses of September, are being unwound, favoring sellers. From the RARI coin chart, therefore, sellers have the upper hand.
Day-Ahead and What to Expect
As it is, the RARIUSDT candlestick arrangement skews for RARI token sellers. However, the uptrend from a top-down analysis remains.
As we advance, traders might unload on pullbacks. However, the reaction at $12.5 might define the short-to-medium term trend for the RARIUSDT price action.
Rarible Technical Analysis
The path of the least resistance in the short-term is southwards.
Although the Rarible coin remains under pressure, optimists might double down, planning to hold in the long term. This overview is only valid as long as the Rarible crypto prices trend above $12.5.
A dip below September 2021 lows might invalidate the bullish outlook, confirming losses of September. In that case, RARI coin prices could dump to $10 and later $6.5.
The Graph (GRT)
The indexing protocol has a global community of curators and indexer nodes using GRT as the main currency.
Past Performance of GRT
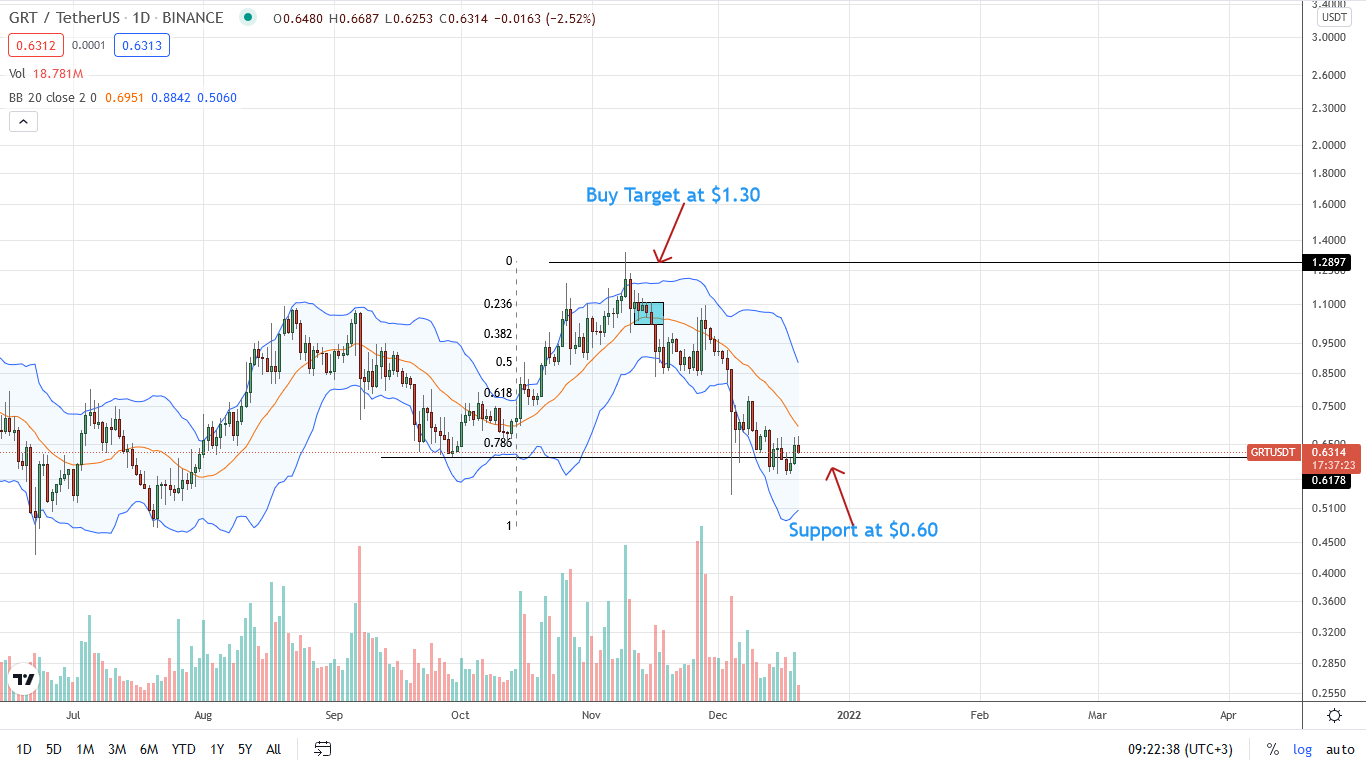
After posting Q4 2021 highs in mid-November 2021, the Graph coin prices plunged 50 percent to spot levels. Encouragingly, there is a revival when writing.
The GRT token is recovering, bouncing from September 2021 lows and soaking in selling pressure of the better part of December 2021.
Day-Ahead and What to Expect
GRTUSDT prices remain in a broad consolidation.
There may be flashes of strength, but they appear transient, favoring sellers. How GRT coin prices hold above $0.60 and September 2021 highs would determine the short-term trend in the days to come.
Confirmation of recent gains may drive GRTUSDT towards $1.30.
The Graph Technical Analysis
There are higher highs relative to the lower BB, signaling GRT crypto prices awakening.
As price action stands, the primary support is at $0.60.
A buildup of GRT token bullish momentum above $0.70 and the middle BB, especially, might draw more buyers into the picture.
In that eventuality, GRT token buyers might target $0.90—the December 4 high. Conversely, losses below $0.60 squash hopes of the uptrend.


