Synthetix (SNX) and KAVA Technical Analysis: Accumulation Limits the Upsides
Table of contents
Synthetix (SNX)
The Ethereum platform allows for the creation of synths of which SNX is the governance token.
Past Performance of SNX
The Synthetix price is trailing leading layer-1 coins reading from the SNX technical analysis of the daily chart.
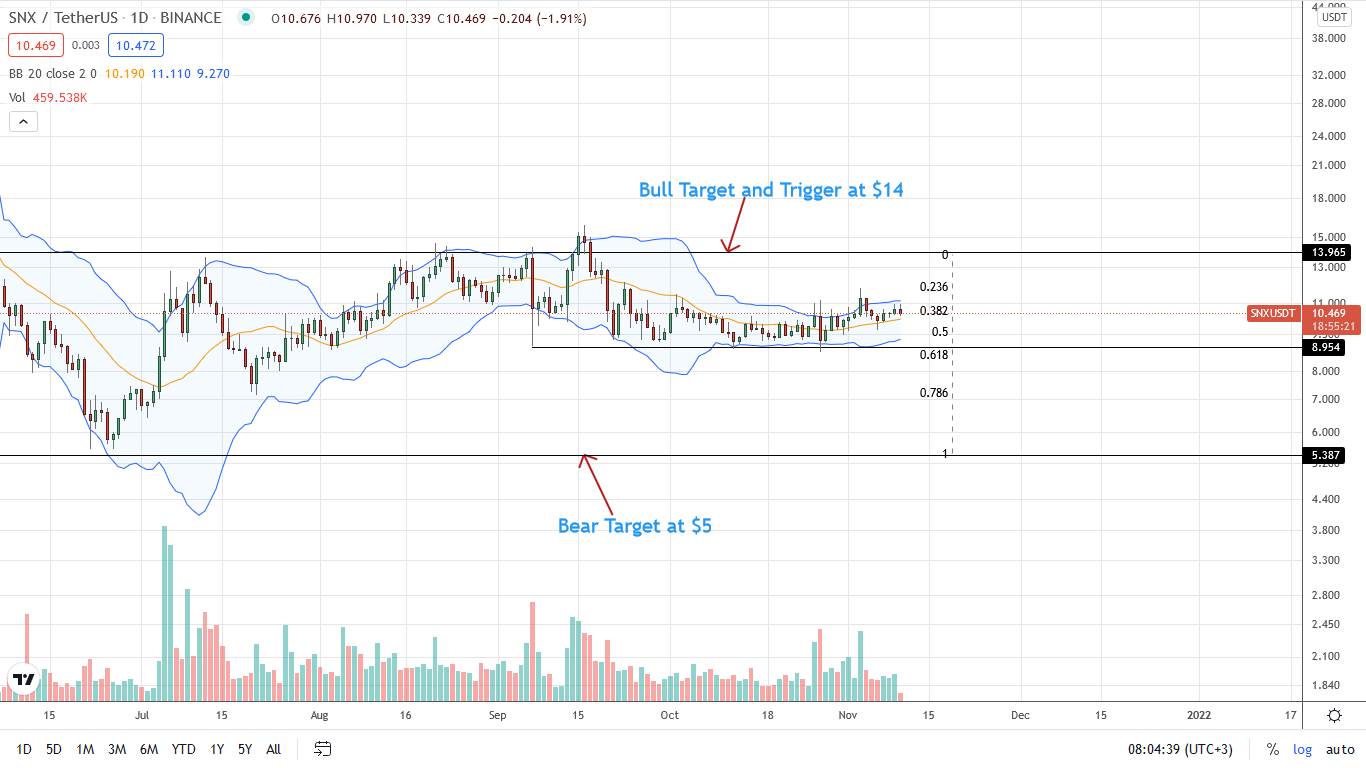
SNX/USDT prices are in a tight consolidation below the primary resistance level at $14, under-performing the greenback.
Day-Ahead and What to Expect
The technical candlestick arrangement of SNX coin prices favors the greenback in the short term.
In the current sideways movement, the Synthetix crypto price is in a tight range, defined mainly by the October 27 bear candlestick.
A close above $11.5 and October 2021 highs may revive buyers, pushing SNX coin prices higher.
However, a dump below $9.5 may fuel sellers aiming at $9—October 27 lows—in a retest and probable close below.
Synthetix Technical Analysis
The path of the least resistance skews to favor sellers, judging from price action in the daily chart.
From a volume analysis perspective, the tight trending of prices inside October 27 places sellers ahead.
Moreover, trading volumes have been dropping to a hint of cautious traders.
A close below $9.5 and $9 may see SNX prices tank to $7.5—the 78.2 percent Fibonacci retracement level of the H2 2021 trade range.
KAVA
The cross-chain borrowing and lending platform is powered by KAVA.
Past Performance of KAVA
The crypto market may be buoyant, expanding, but KAVA crypto prices are limited.
As per the KAVA technical analysis in the daily chart, KAVA/USDT prices are within a multi-week wedge.
Nonetheless, the uptrend is still valid above $5.
Day-Ahead and What to Expect
KAVA/USDT prices are trending higher, buoyed by buyers who have thus far sustained prices above the crucial multi-week support trend line and $5.
A close above the resistance trend line and wedge at $6.5 may drive the KAVA token price to $7.5 in a bullish continuation pattern.
KAVA Technical Analysis
Technically, KAVA buyers are confident despite the recent lower low and failure of buyers to overcome the selling pressure at $6.5.
Aforementioned, buyers have a chance as long as prices are above $5.
Besides, a close above October 2021 highs may draw more demand, lifting KAVA/USDT towards $7.5—a swinging opportunity for aggressive KAVA traders.


