


Terra Name Service (TNS) Gains Over 150% in 24 Hours


TNS Current and Past Market Status
At the time of writing, TNS chart shows that it is trading at $0.023. On May 20th, the price of TNS opened at a price of $0.0103 and closed at a price of $0.0404 on May 21st. This represents over 150% rise in price in 24 hours. This is due to a rise in TNS trading volume by over 12% within 24 hours. The present all-time high price of TNS is $2.34 and was attained on December 25th, 2021.
Terra Name Service Price Analysis
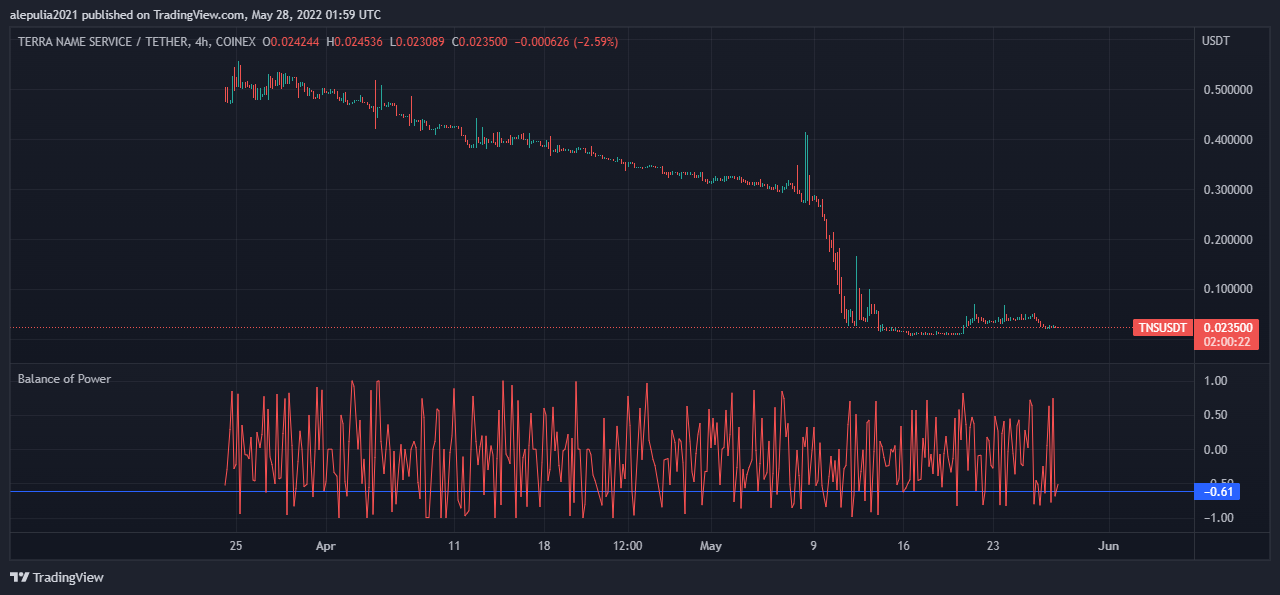
TNS/USDT 1Day chart showing the Balance of Power Indicator
Source: https://www.tradingview.com/x/HwzcWPLa/
From the chart above, we can see that the Balance of Power indicator reading of the Terra Name Service price chart is -0.61. This shows that it has a negative divergence in price and that the price might dip further. However, strong buyer pressure could push the price chart to a bullish trend reversal.
TNS Price Prediction Chart
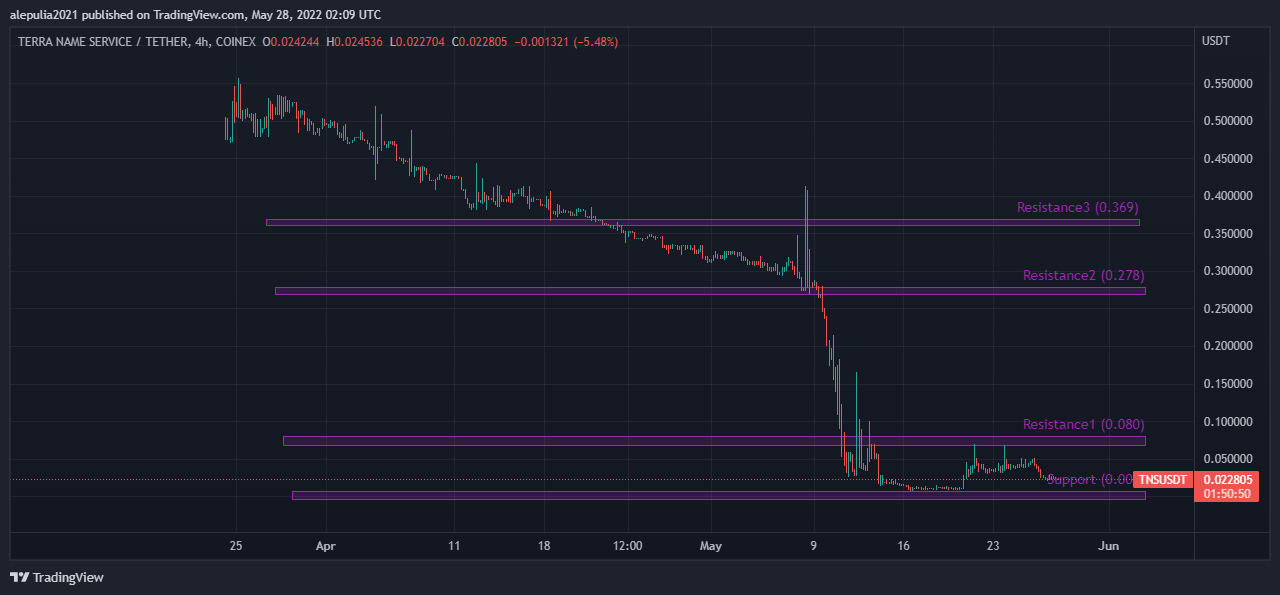
TNS/USDT 1Day Chart Showing the Key levels
Source: https://www.tradingview.com/x/vfMzHspC/
From the TNS price prediction chart above, showing the resistance and support levels, we can deduce the following:
Conclusion
We expect the price of Terra Name Service to remain bullish for long-term hodlers when we consider the price history of Ethereum Name Service (ENS) in recent days.