


THETA Technical Analysis: Finally The Bullish Reversal Kicks-Off


Table of contents
Key technical points:
Past Performance of THETA
THETA prices showcase the sideways trend floating above the $1.18, surpassing the resistance trendline of the falling channel. Moreover, the bullish influence grows over the consolidation as the market price inflates 20% over the past week with a boom in intraday trading volume.
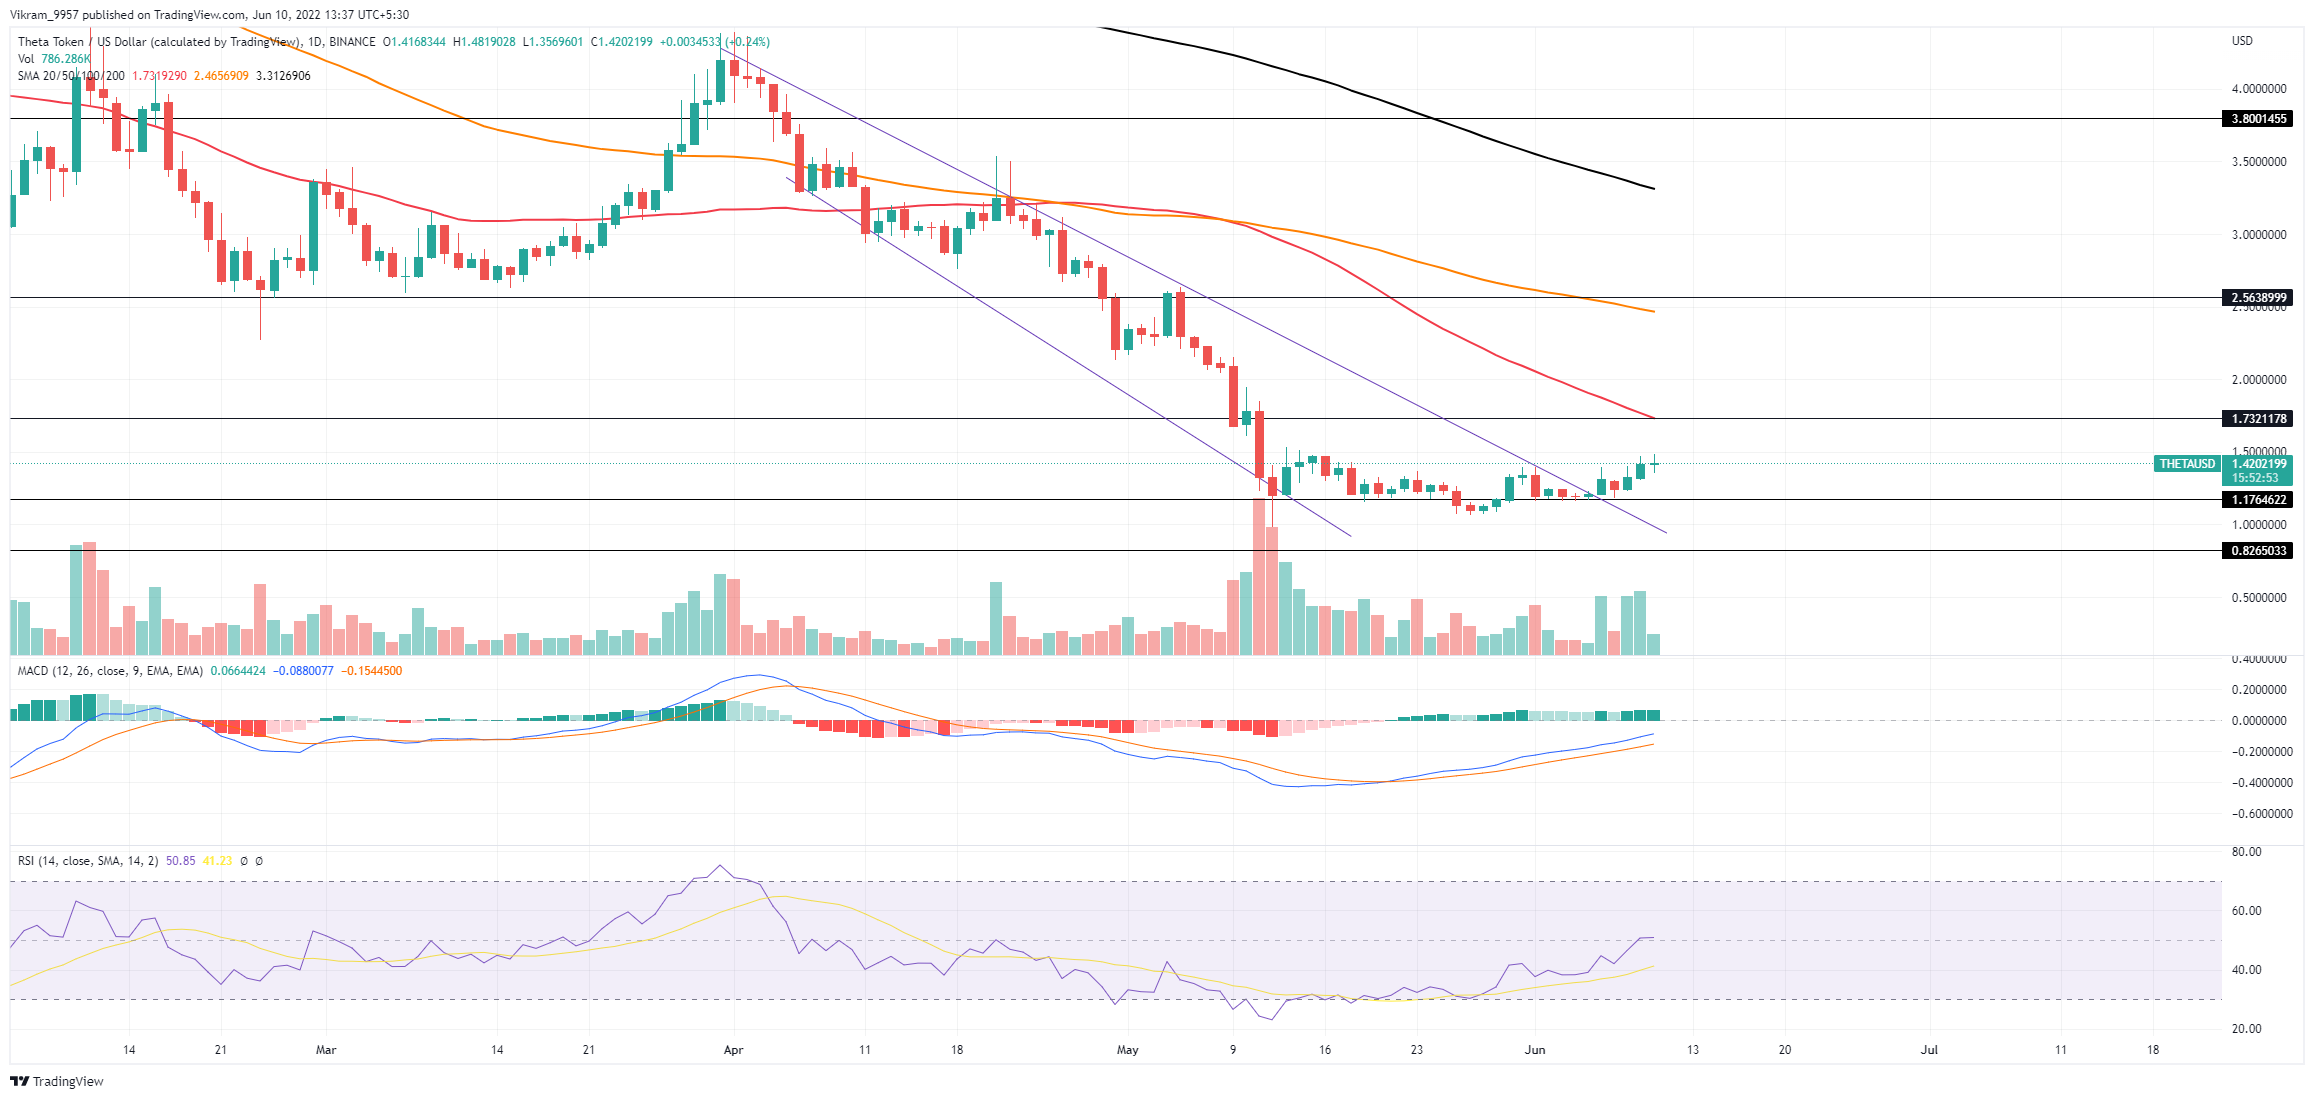
Source- Tradingview
THETA Technical Analysis
THETA prices approach the overhead resistance close to $1.75, and the 50-day EMA reflects a massive bearish opposition ready to knock down the recovery rally. However, the short-term can find bullish entry points at the current market price. The crucial Simple Moving Averages - 50, 100, and 200-days marked as red, orange, and black, respectively, maintain a bearish alignment as the 50-day EMA diverges sharply. However, the recovery rally approaching the 50-day EMA increases the likelihood of a power shift of trend control.
The MACD and the signal lines display the bullish trend crossing over the zero line as the buying spree continues. The increase in the positive histogram intensity adds points to the bullish team. Furthermore, the RSI indicates a constant rise in the underlying bullishness, as the trend continues to climb until it reaches the halfway line. Thus, the indicators show an incredible increase in the buying pressure, which is turning the THETA technical analysis bullish-biased.
Upcoming Trend
If THETA buyers successfully overpower the reach the $1.75, the chances of a bullish breakout will increase significantly and might challenge the psychological barrier of $2.
Resistance Levels: $1.75 and $2
Support Levels: $1.18 and $1