


UNI Technical Analysis: Buyers Prepares A Jump To $8


Table of contents
Key technical points:
Past Performance of UNI
The retracement rally in UNI prices from the $5.90 mark takes bullish support at $4.5, resulting in an 8.7% jump yesterday. The bullish Reversal attempts to complete the inverted head and shoulder pattern with the neckline at $5.90. Additionally, the reversal rally surpasses the 50-day SMA increasing the likelihood of a bullish breakout.
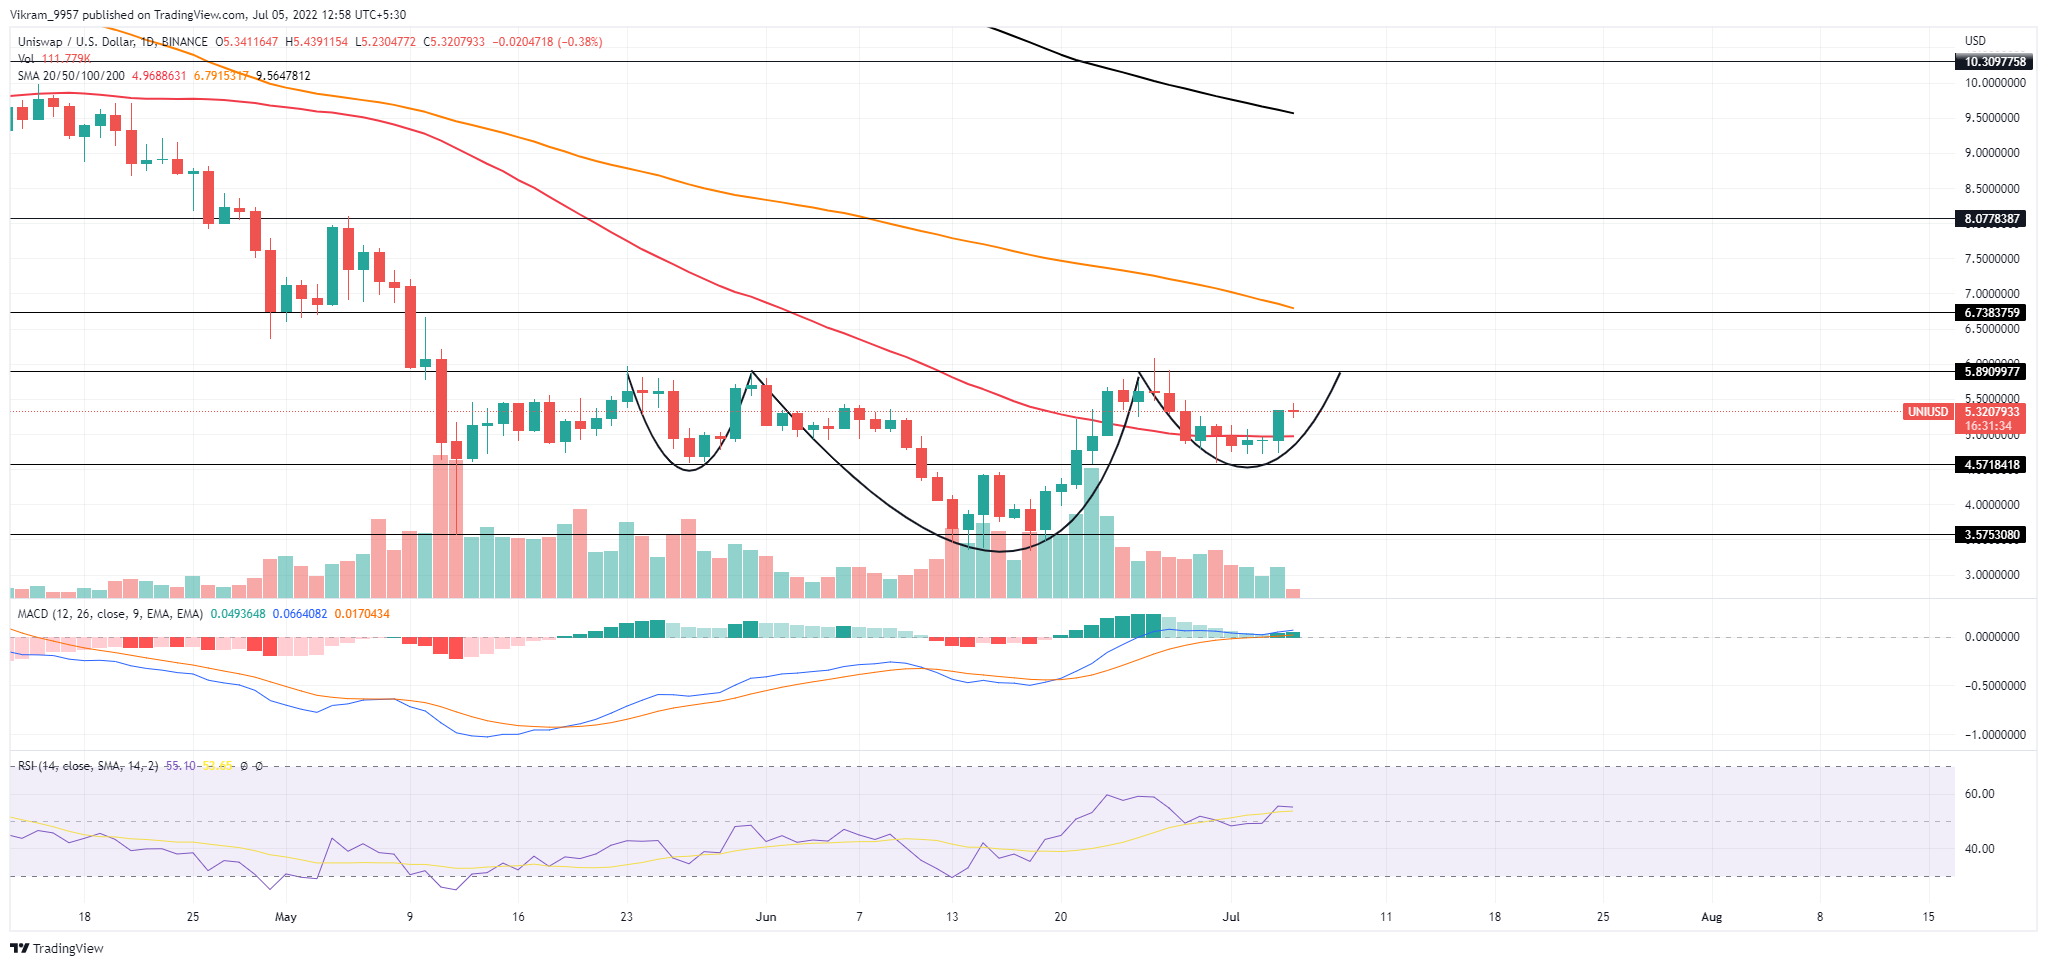
Source- Tradingview
UNI Technical Analysis
UNI price Actions showcased a fall in trading volume during the retracement phase, but the recent price jump comes with a boom in trading volume. Hence the traders can expect the breakout rally to reach the overhead resistance at the 100-day SMA at $6.75. The MACD indicator showcases the fast and slow lines sustaining about the zero line in maintaining a bullish trend. Moreover, the bullish trend in MACD histograms resurfaces, displaying a rise in buying pressure.
The RSI indicator Showcases a rise in the underlying bullishness as the slope sustains about the halfway line and surpasses the 14-day SMA. Moreover, the bullish divergence in the RSI indicator is pretty evident, which increases the likelihood of a prolonged uptrend. Hence the technical indicators maintain a bullish bias for the upcoming trend and support the idea of prices skyrocketing after the pattern breakout. In a nutshell, the UNI price analysis Displays the technical indicators going hand-in-hand with the price action analysis.
Upcoming Trend
UNI buyers can expect the Market value to sustain about the 50-day SMA and breach the neckline at $5.90 to start a breakout rally. The breakout rally shows the potential to reach the 100-day SMA at $6.75
Resistance Levels: $5.90 and $6.75
Support Levels: $4.5 and $3.5