


XDC Price Trend Sustains Bullish Hope Despite A Drastic Fall


Table of contents
Key Points:
Source - Tradingview
XDC Technical Analysis
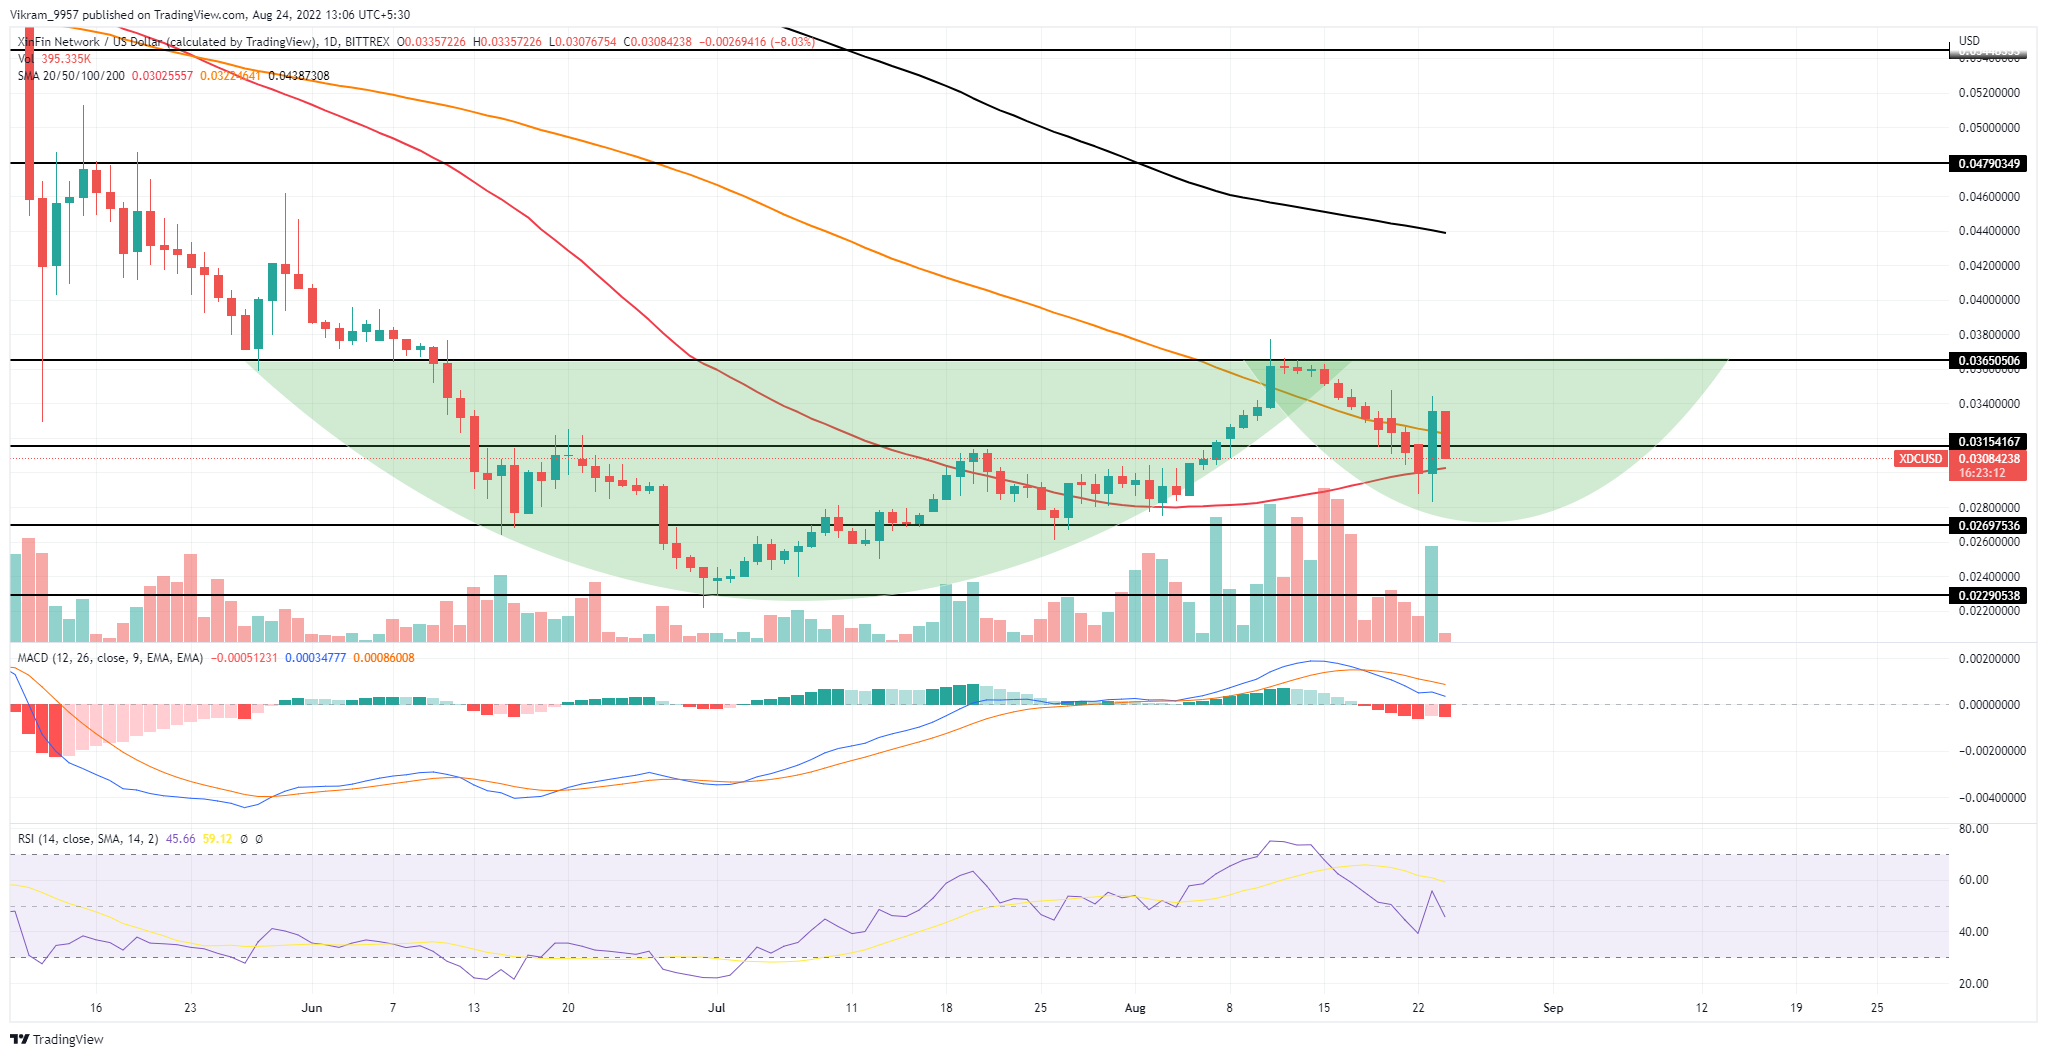
The V-top reversal from $0.0365 resistance tumbled the prices by 22.8%, hitting the combined support zone of $0.028 and 0.618 Fibonacci retracements. On August 23rd, the XDC price witnessed a significant inflow resulting in an 18% price jump.
The massive bullish candle breached the immediate resistance of $0.0312, suggesting the continuation of the prevailing recovery. However, today the coin is 7.5% down, and testing pierced resistance is for suitable support. If the daily candle managed a closing above the $0.0312 mark, the buyers should drive the altcoin 17% higher to hit $0.036 resistance.
Another theory to support this rally is forming a cup and handle pattern. This reversal pattern is often spotted at market bottoms and ignites a significant recovery if market sentiment favors it.
Thus, under this pattern's influence, the XDC price should poke through the prior swing high of $0.0365 and offer a 32% growth potential to the $0.48 mark.
Technical Indicators
The RSI indicator failed to sustain above the neutral line, indicating the market sentiment is still weak.
The breakout candle even reclaimed the 50-and-100-day SMA, providing some extra edge for coin buyers. Thus, the 50 SMA wavering around the $0.0312 mark assists traders in giving different footing for price recovery.
Resistance Levels: $0.0312 and $0.034
Support Levels: $0.028 and $0.026