


XLM Technical Analysis: Will Stellar Prices Surpass $0.15?


Table of contents
Key technical points:
Past Performance of XLM
The bullish reversal on 14th March from $0.16 failed to surpass the resistance level at $0.24 resulting in the bearish trend we saw in April and early May. The bullish failure led to a downfall which cut the market value in half resulting in a fall below $0.15 to take support at $0.10 which helped the reverse the falling trend. However, the reversal rally struggles to surpass the resistance confluence of the 50-day EMA and the $0.15 mark.
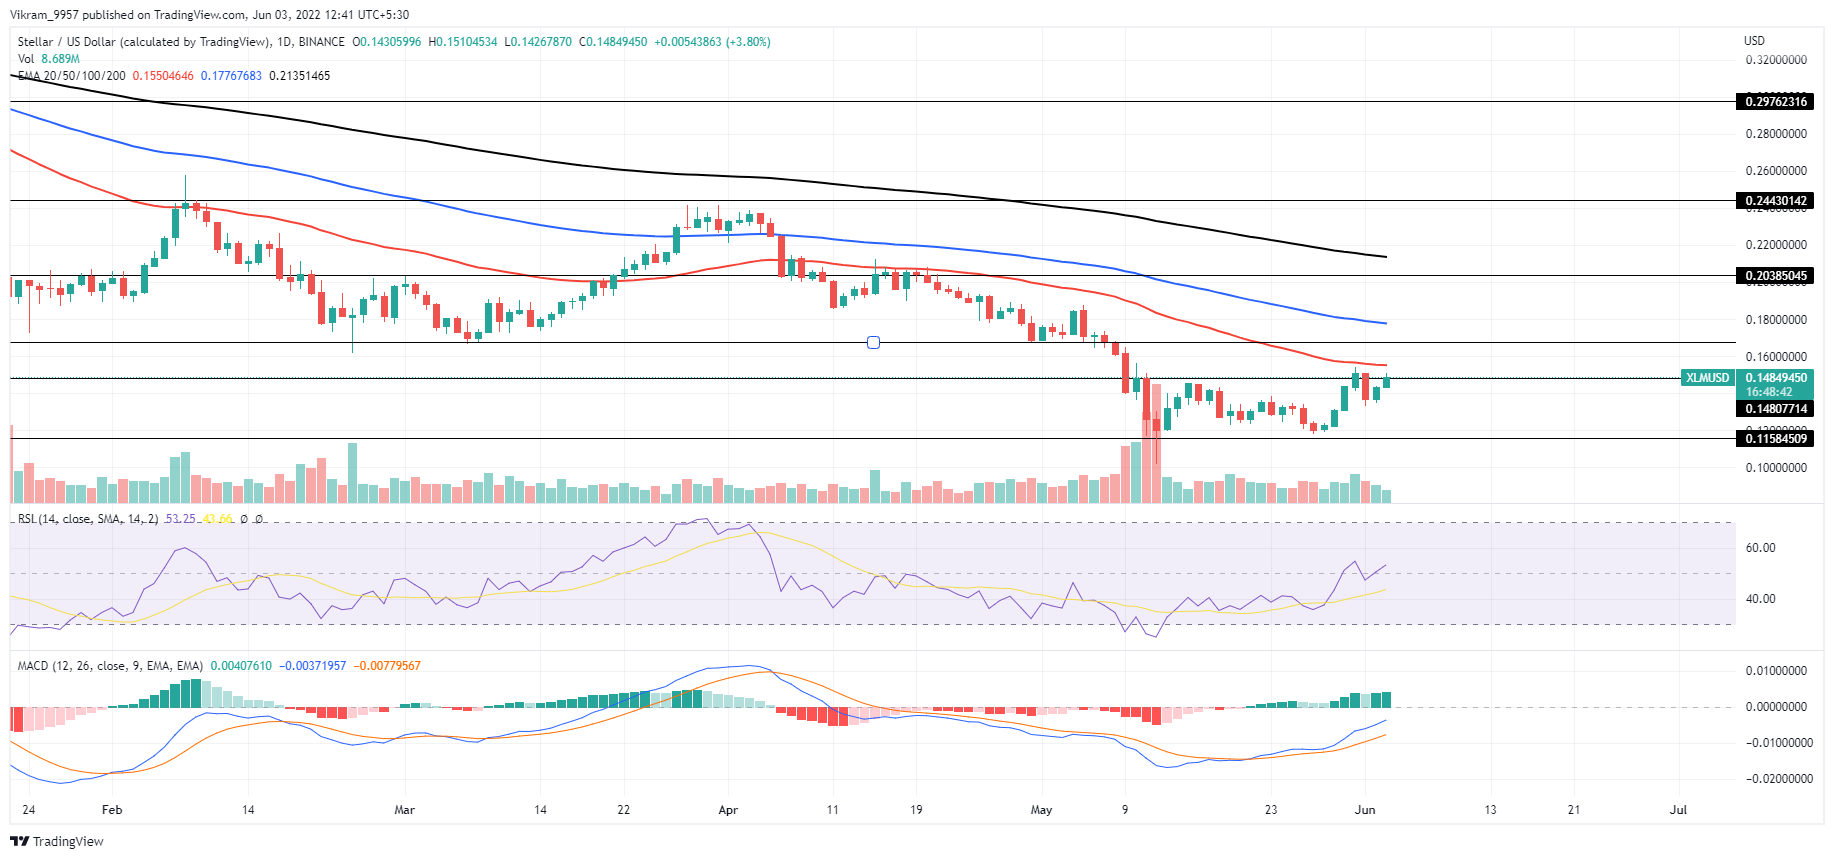
Source- Tradingview
XLM Technical Analysis
XLM/USD price chart showcases the 50(red), 100(blue), and 200(black)-day EMAs in a bearish alignment but developing a sideways shift as the market value inflates. Therefore, the breakout of the 50-day EMA will increase the likelihood of a price jump reaching the $0.18 mark, close to the 100-day EMA. The RSI slope shows a bullish trend surpassing the halfway line and driving the 14-day SMA higher to exit the nearly oversold zone. Furthermore, the MACD indicator shows the fast and slow diverging to regain the bullish alignment and rise higher to approach the zero line with a rising trend in bullish histograms. Hence, the momentum indicators project a rise in the buying volume and tease the 50-day EMA breakout possibility. In a nutshell, XLM technical analysis indicates a high likelihood of an uptrend reaching $0.20.
Upcoming Trend
The $0.15 breakout will signify the breakout entry in XLM and buyers with bullish sentiment can expect the unleashed bullish momentum to drive the uptrend to $0.18. Moreover, the 100-day EMA breakout can lead the uptrend to $0.20 possibly. However, a reversal from the 50-day EMA would reverse the uptrend to retest the $0.135 mark.
Resistance Levels: $0.18 and $0.20
Support Levels: $0.135 and $0.115