


XMR Technical Analysis: Back at $200, Will XMR Rise Again?


Key technical points:
Past Performance of XMR
XMR token price trades at $207 with more than 2.09% overnight fall. The downfall breaks under the 200-day EMA and shows a dip at the psychological barrier of $200. However, buyers lining up to buy the dip result in a bullish piercing candle.
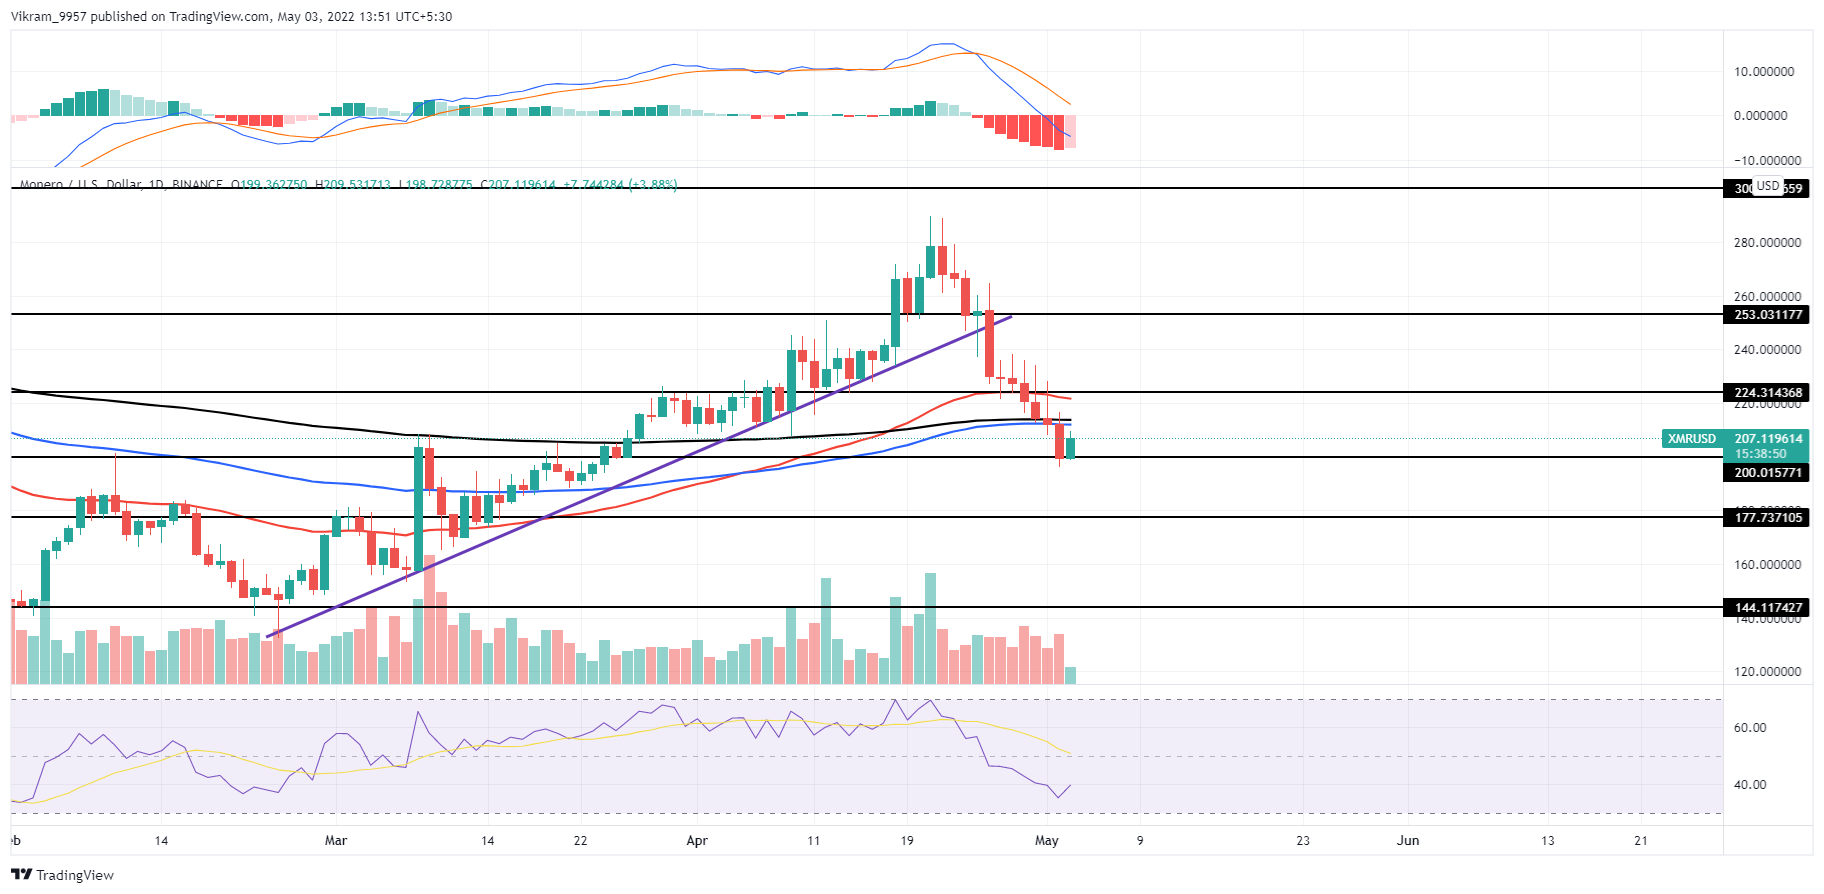
Source-Tradingview
XMR Technical Analysis
XMR coin price shows higher price rejection in the daily candle during the 90 points last fortnight, implying a formidable selling pressure. Hence, the recovery projects a higher likelihood of being a retest rather than a trend reversal point. Moreover, the lack of significant increase in trading volume questions the bull run possibility.
The correction rally induces a bearish influence on the 50-day EMA, resulting in a falling trend and lowering the chances of the 100 and 200-day EMA bullish crossover. Moreover, the market price retests the merged EMAs with an evident higher price rejection.
The RSI slope displays a minor reversal from the oversold zone, ready to approach the 14-day SMA.
The MACD and signal lines project a huge bearish spread, continuing to grow as the lines fall under the halfway mark. Moreover, the MACD histograms display a remarkable trend in motion, giving an idea of the formidable underlying bearishness.
In short, the XMR technical analysis displays a bearish trend soon to break under $200.
Upcoming Trend
XMR coin price fails to find a bullish commitment at the psychological mark of $200 as the trading volume remains unimpressive. That's why traders can find a selling opportunity with closing below the psychological mark.
Resistance Levels: $225 and $250
Support Levels: $200 and $180