


XMR Technical Analysis: Big Problems For Buyers And The Mark Of $123


Table of contents
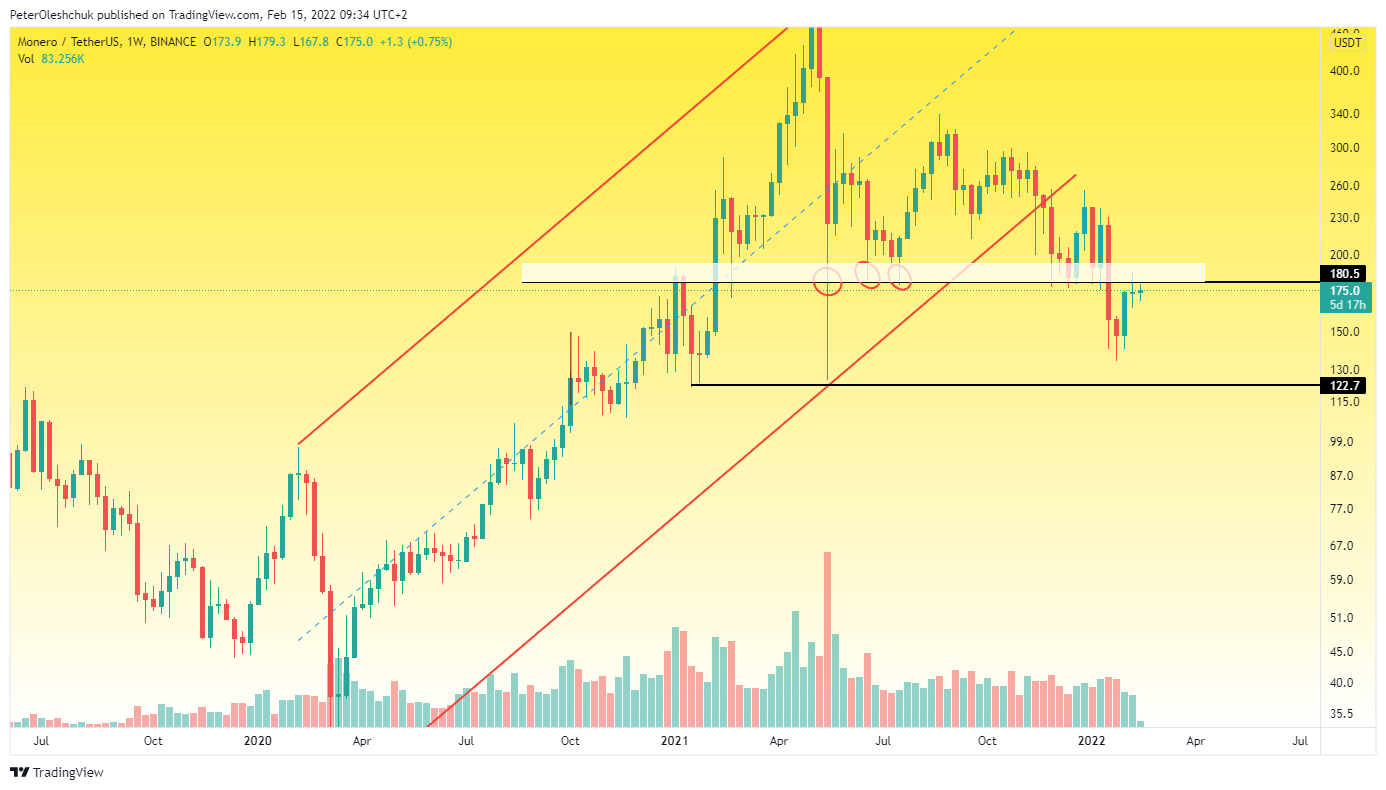
Trading volumes during the breakout of the $187 range were average. But, now buyers are trying to get along with sellers, the trading volumes is even smaller. This indicates a low interest of buyers in the formation of a new growth trend. In this case, the main and most likely scenario in the XMR market is to continue falling to $123. It was this mark that was able to stop the powerful fall wave in May 2021 and give market participants a powerful price rebound.
Technical Analysis Of XMR On The Daily Timeframe

The new timeframe also indicates a new fall wave. If the local growth wave on 4 February looked cheerful and full of optimism, the current upward movement looks like the last breath before capitulation. The movement of prices occurs at reduced volumes. Such a signal in front of a strong liquidity zone is clearly not an aggressive continuation of growth. The first local point where the XMR price can fall is at $159. It is from this mark that buyers can create a new attempt to grow and break $187. However, if the rebound from $159 is as lazy and weak as it is now - a global negative scenario will take effect, the fall will continue to $123.
XMRBTC Price A Step Before Breaking The Local Low

Analyzing the price movement of XMRBTC on the daily timeframe, we tried to find optimism. But, it is not here either. Sellers firmly pressed the price to the lower liquidity zone of 0.004. As a trend line, sellers have minimized volatility in the XMRBTC market. So more likely by mid-March, we will see a new XMRBTC momentum down. Given the fact that the price has been moving in a flat-bottomed consolidation triangle since April 2021, the new impulse will be strong.