


XMR Technical Analysis: Rejection At $200 Demands Trendline Retest


Key technical points:
Past Performance of XMR
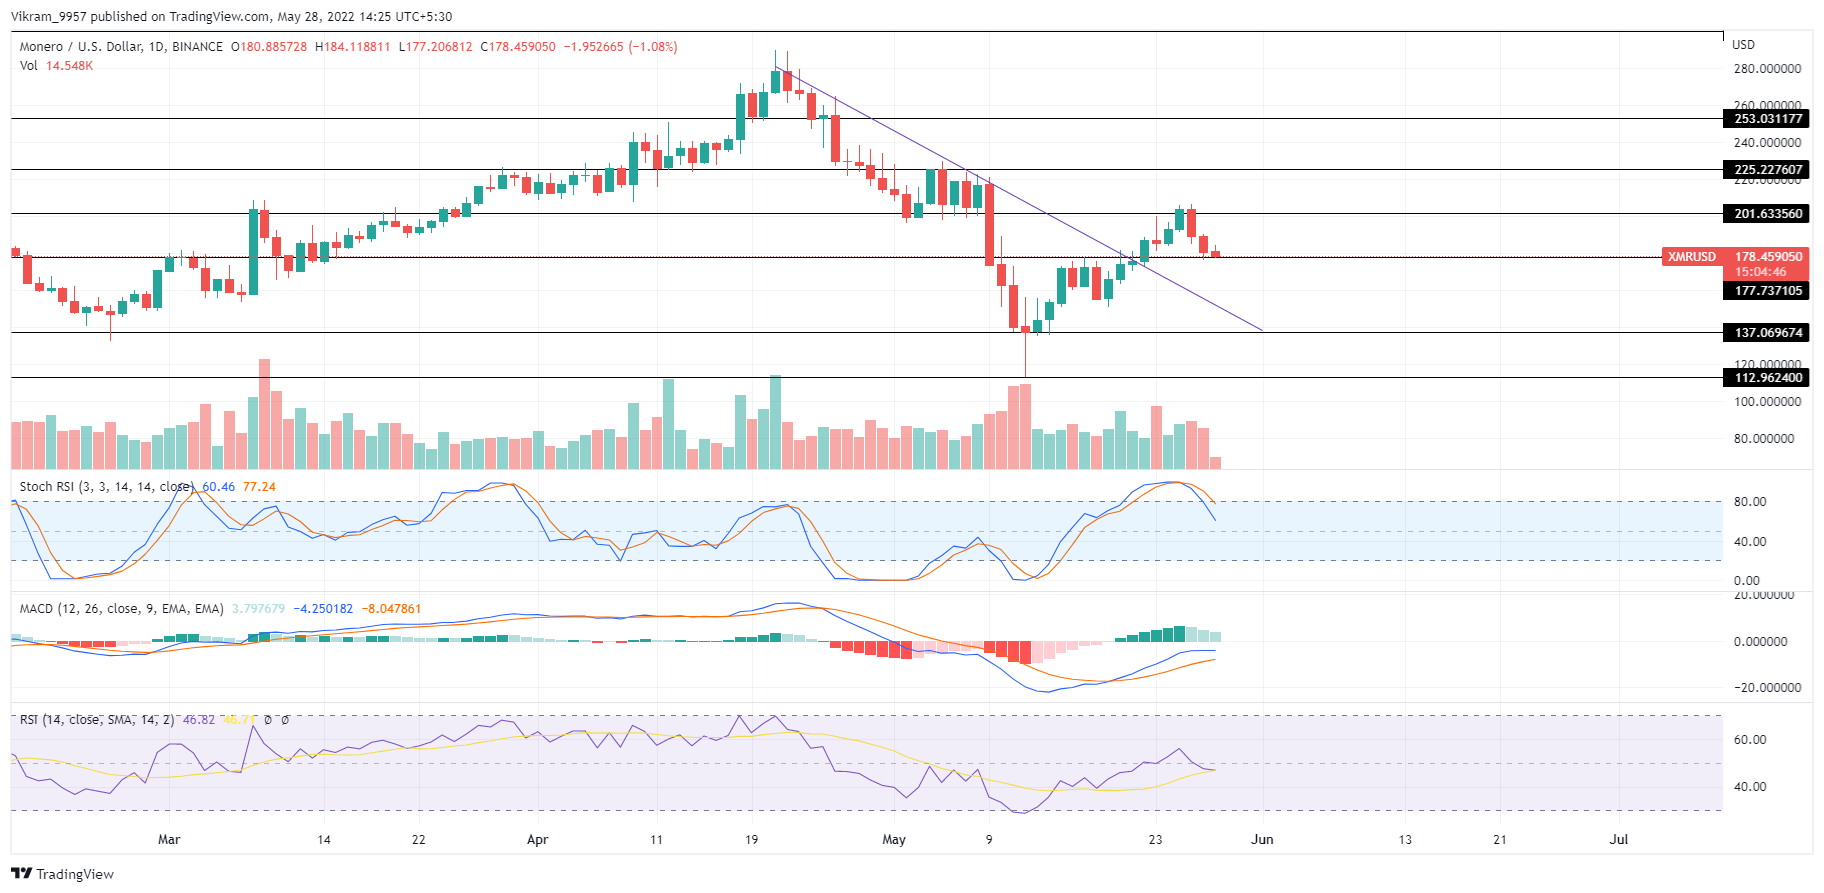
XMR prices take a sharp bearish turnaround at the end of April, resulting in a downfall of 50%, dropping the market value to $140. However, the bullish reversal immediately recovered the 5% of the failure to reach the $200 mark. Nonetheless, the bears overtook the trend control resulting in a 12% fall to retest the $175.
Source-tradingview
XMR Technical Analysis
The bearish trend starting after the rejection at $200 warns of a downfall close to $150 as the reversal aims to retest the broken resistance trendline. Moreover, the support from the rising trend in the intraday volume adds points to the bearish ideology.
Coming to the technical indicators, a bearish retracement can be seen in all the indicators displaying a bearish takeover. The MACD indicator showcases a high bearish crossover probability as the bullish trend of histograms weakens. The RSI and stochastic RSI shows a bearish trend back in action and warns of the fallout of $175.
Therefore, the indicators are highly bearish and signal a selling phase in the XMR price chart.
Upcoming Trend
Suppose the sellers continue to pressurize the XMR market value; we may shortly see a downfall under the $175 support level. This will lower the XMR price to the next support level at $150. And, in the unlikely event of a bullish reversal, the upside rally could break the resistance trendline and reach the $200 mark.
Resistance Levels: $200 and $225
Support Levels: $175 and $150