


XRP Technical Analysis: Price Level to Watch Out Is Below the First Fibonacci Pivot Resistance Level of $0.74


Past Performance
On Jul 22, 2021, XRP opened at $0.57. On Jul 28, 2021, XRP closed at $0.72. Thus, in the past week, the XRP price has increased by roughly 26%. In the last 24 hours, XRP has traded between $0.63-$0.75.
Day-Ahead and Tomorrow
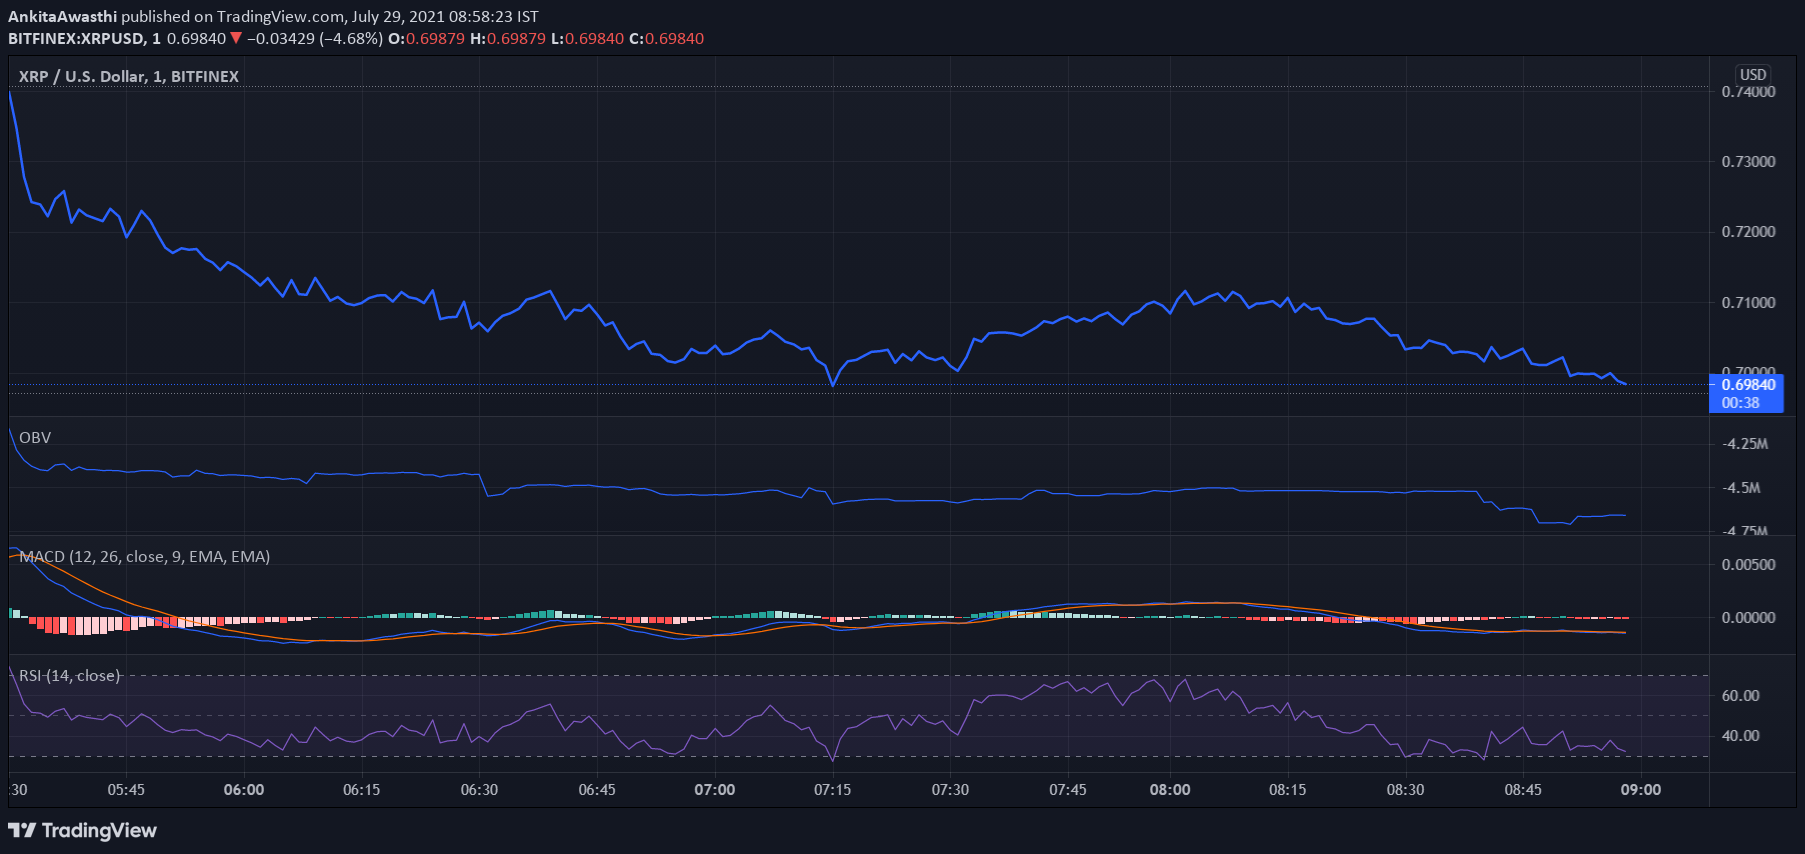
Currently, XRP is trading at $0.70. The price has decreased from the day’s opening price of $0.72. Thus, the market seems bearish.
The MACD and signal lines are negative. Moreover, a bearish crossover by the MACD line over the signal line has occurred. Thus, the overall market momentum is bearish. Hence, we can expect the price to fall further.
Currently, the RSI indicator is at 42%. It faced rejection at 34% and rose to the current level. Hence, buying pressures are mounting. High buying activity will exert upward pressure on the XRP price.
However, the OBV indicator is downward sloping. Thus, selling volumes are higher than buying volumes. Hence, the price may fall further.
In a nutshell, when we look at all three indicators together, the overall market momentum is bearish. However, the possibility of a bearish trend reversal cannot be ruled out.
XRP Technical Analysis
Currently, the price is below the first Fibonacci pivot resistance level of $0.74. The price may soon fall below the Fibonacci pivot point of $0.70. After that, we have to wait and watch if the price continues to fall or starts rising.
The price may soon test and fall below the 61.8% FIB retracement level of $0.70. It may further fall below the 50% FIB retracement level of $0.69. If the price retests and surpasses these levels by day close, a price uptrend has probably set in. In that case, the price upswing may continue tomorrow as well.