


HNT Technical Analysis - HNT Prices Ready To Jump 40%
Helium prices have fluctuated in a consolidation range for almost the last five weeks, but this consolidation forms a bullish pattern with the neckline at $12. However, the dubious nature of a bullish reversal in a bear market is a highly dangerous and extremely volatile entry spot.
Well, evening crypto traders,
This is Megha Chhikara, back with a brand new coin for you!
Today, we’ll be reading about Helium, as it shows a bullish reversal within a breakout event and try to figure out if it is safe to go against the broader market trend in this coin. Watch the entire video till the end to learn more about the upcoming trend in HNT, and don’t forget to hit the subscribe button!
Currently, HNT’s market value is $11.15 at 9:30 GMT, displaying an ongoing buying spree as it has increased by 4.95% in the past 24 hours!
Let’s see what the graphs have to say about HNT today!
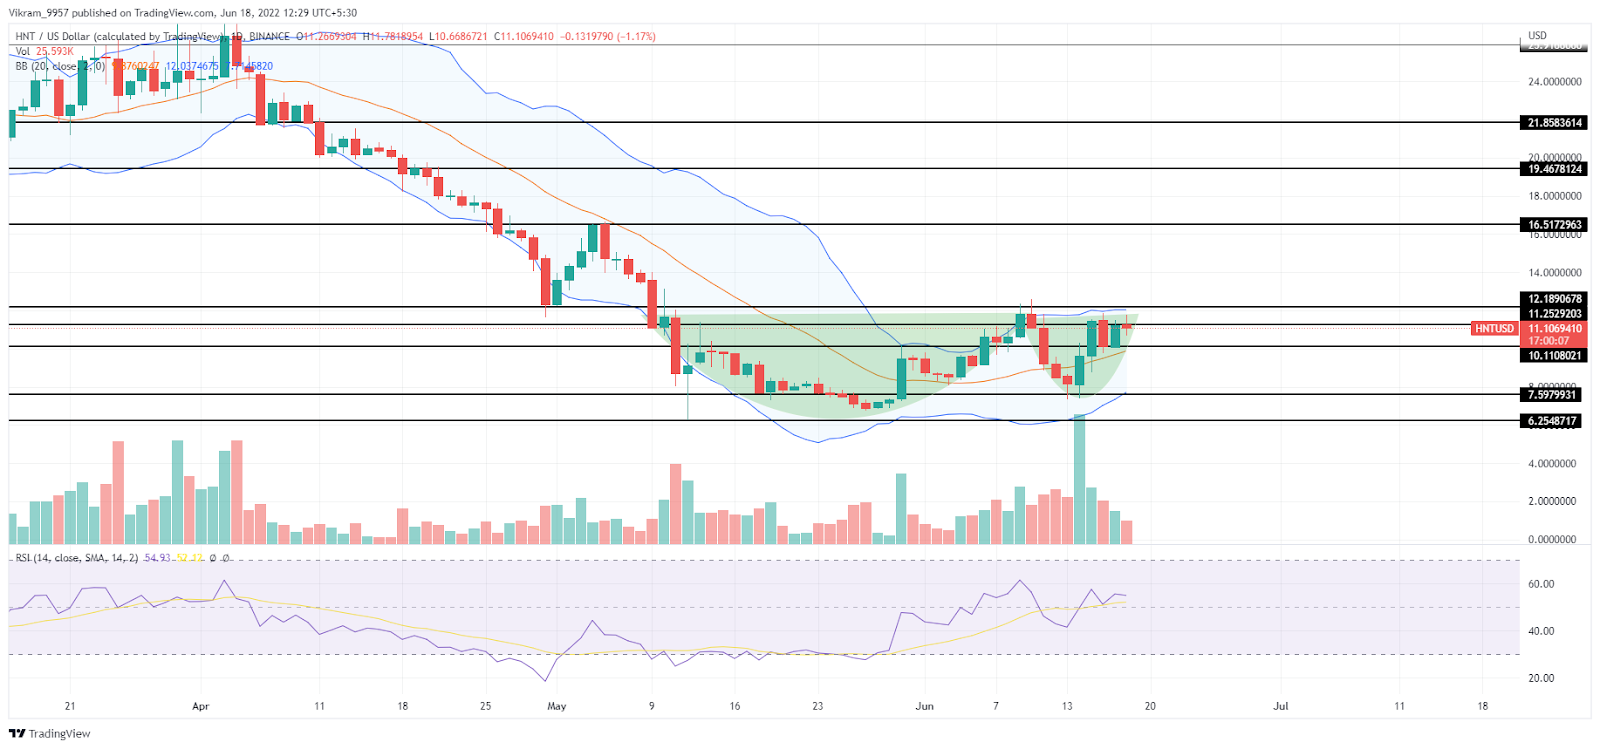
https://www.tradingview.com/x/HHYbU4Gw/
The crash in April and May plunged the pair of HNT/USDT to a record low in 2022 of $6.64. Additionally, the buyers buying at discounted prices increased the price 75.5 percent higher, to test the resistance level of $12.
In the course of last week's sell-off, the HNT price had a minor pullback before challenging the high resistance at $12. In addition, this entire consolidation reflects a Cup and handle pattern suggesting a potential recovery.
Let us now have a look at the technical indicators and check if they support the bullish price action analysis.
The price trend is diagonally upwards, and the daily-RSI slope rises higher, indicating the increase in buying momentum. This bullish divergence encourages buyers to look for an upward breakout of the pattern's neckline.
Bollinger bands indicator The oscillating prices between the middle line and lower section of the Bollinger band indicator indicates high bearish pressure. But, the daily candle surpasses the midline and enters the bullish zone. This suggests that buyers are taking control of the bears.
In conclusion, if the price of HNT can sustain and surpass the $12 neckline, buyers will push the altcoin towards its initial goal of 38% more and up by $16.7.
On the other hand, if the HNT price failed to break the resistance of $12, the consolidation rally could continue for several additional sessions.
This was the technical analysis for HNT. We hope this was helpful, and you got what you were looking for!! If you enjoyed the session, please subscribe to Cryptoknowmics!!