


XLM Technical Analysis: The First Steps To Change The Trend


Table of contents
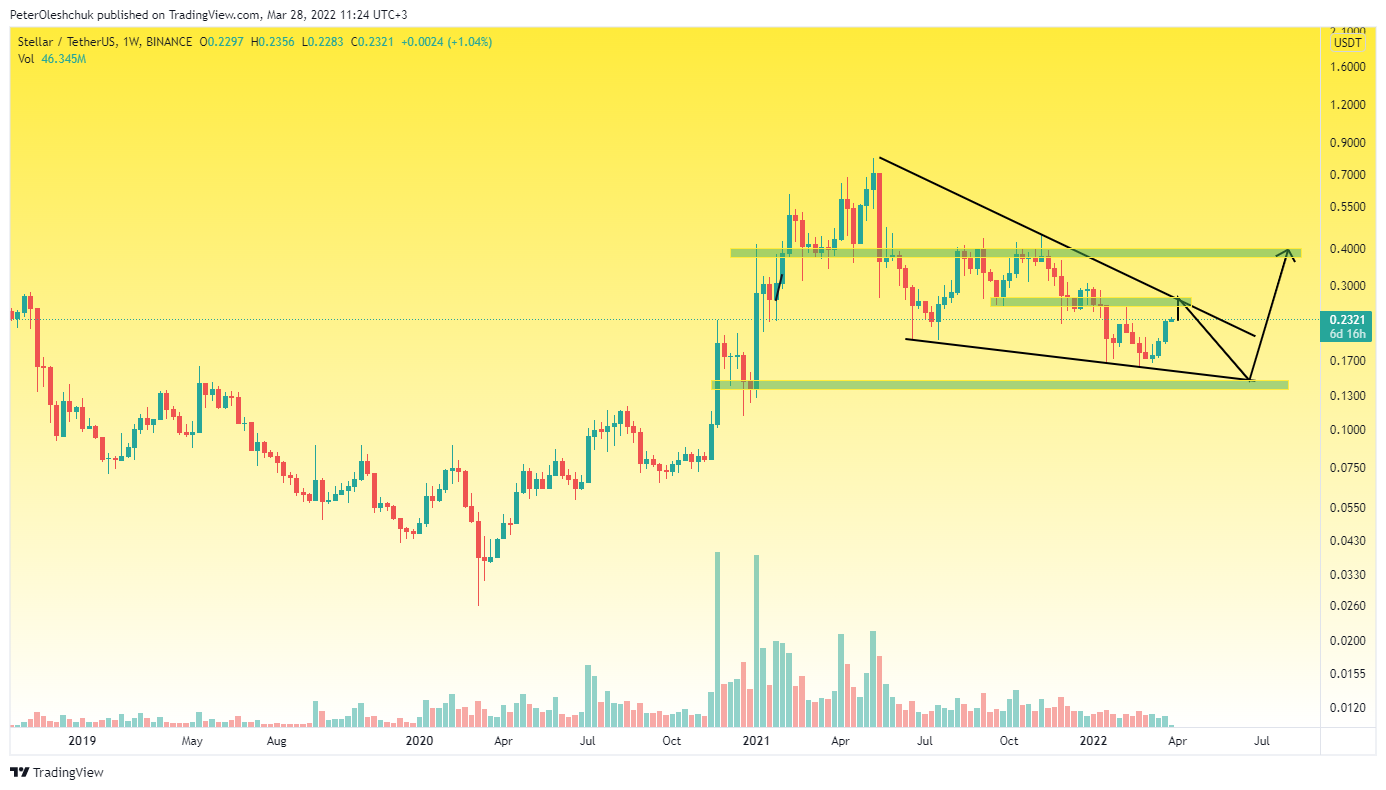
The worst-case scenario at the time of writing is the retention of $0.27 by sellers and another fall wave to $0.13. This scenario is quite real, given the trading volumes in the weekly timeframe. However, even such trouble for investors will not be a problem to start forming a new growth wave with the first global target of $0.4. At the moment, our main global scenario is a global consolidation of the XLM price in the range of $0.13-$0.4. Therefore, we do not expect to update the XLM historical high in the near future.
XLM Technical Analysis On The Daily Timeframe
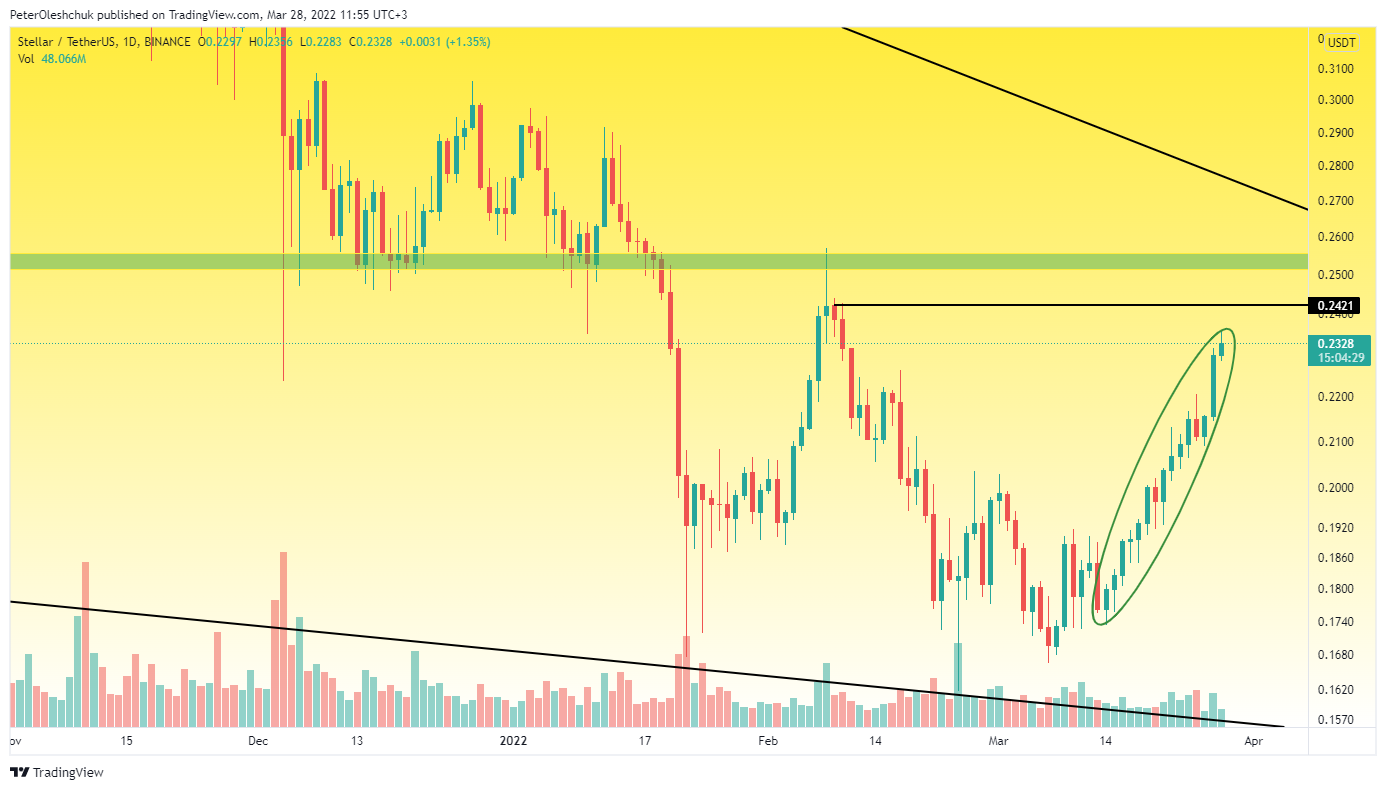
Analyzing the XLM price movement on the daily timeframe, you can see the total absence of sellers, starting from 14 March. Buyers without any problems, due to low trading volumes raised the XLM price by 34%. Given the lack of struggle, the XLM price growth will easily continue to reach $0.24. In this local mark, sellers began their activities on 8-9 February. It was at this point that the daily candles closed after unsuccessful attempts by buyers to continue their initiative.
Therefore, in the event of an increase in trading volumes and the beginning of price slowdown at around $0.24, you should be ready for the reversal of the XLM market. In this case, we will expect consolidation in the range of $0.18-$0.24. In this consolidation, buyers will be able to gain long positions at good prices and buy off the remnants of sellers at local lows.
The XLMBTC Price Is Still Within The Local Fall Channel
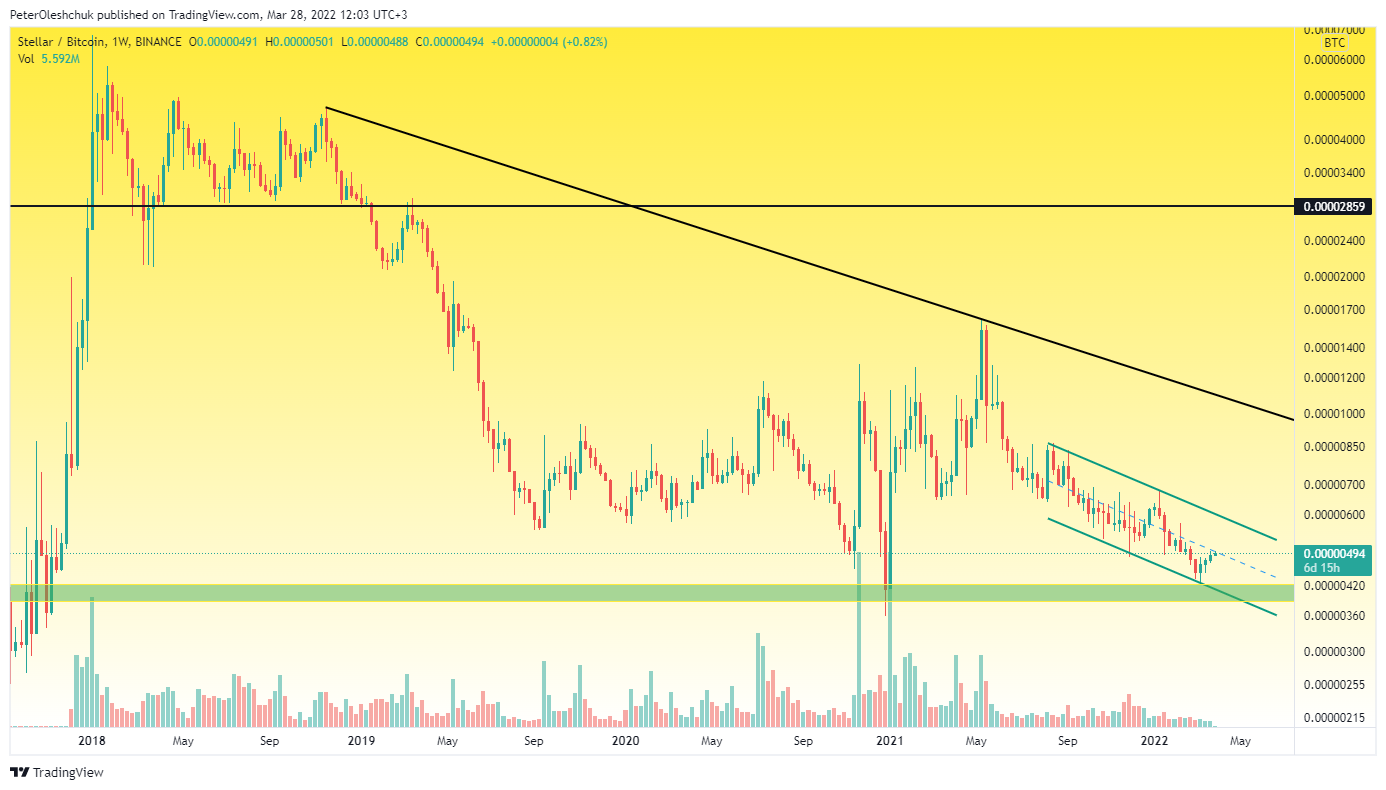
However, the relative success of the XLM cryptocurrency is still insignificant compared to the situation on the XLMBTC chart. In the weekly timeframe, we see that the XLMBTC price is confidently moving within the local fall channel. Now buyers are trying to take control of its middle trend line to cover the top of the channel. Prospects for growth in this case -20%. However, globally, until buyers break the upper trend line of this channel up - it is too early to buy XLM globally. Ideally, you should buy XLM cryptocurrency after fixing the XLMBTC price above 0.00000660. In this case, the growth prospect will reach 0.0000107. Otherwise, while the price is in a downward trend, before the mark of 0.00000395 we would not consider buying XLM for medium and long-term purposes.